
Logs & Usage
Logs & Usage
Logs & Usage is the audit and consumption intelligence layer of AI Governance. It provides complete visibility into every AI interaction, background process, and Codex job executed across your organization — along with budget controls, governance alerts, and consumption analytics.
The section is organized into eight tabs: Assistant Logs, Worker Logs, Codex Logs, Budgets, Alerts, Assistant Consumption, Worker Consumption, and Codex Consumption.
Who Uses This Section
| Role | How They Use It |
|---|---|
| CISO / Security Officer | Review interaction logs for anomalous queries or unauthorized usage. Monitor governance alerts. Use logs as audit evidence for access reviews and incident investigations. |
| Compliance Officer | Export interaction and consumption data to support SOC 2, ISO 42001, NIST AI RMF, and EU AI Act audit packages. Verify data retention is operating per policy. |
| Platform Administrator | Set and monitor budget policies to prevent runaway token or AVU consumption. Acknowledge and resolve governance alerts. |
| CTO / Technical Lead | Analyze consumption dashboards to optimize model selection, identify high-cost assistants, and track provider health trends. |
| AI Product Owner | Review assistant-level response counts, efficiency, and token usage to measure performance and plan capacity. |
| Finance / Operations | Use AVU Cost by Model and consumption charts to support AI cost attribution and chargeback processes. |
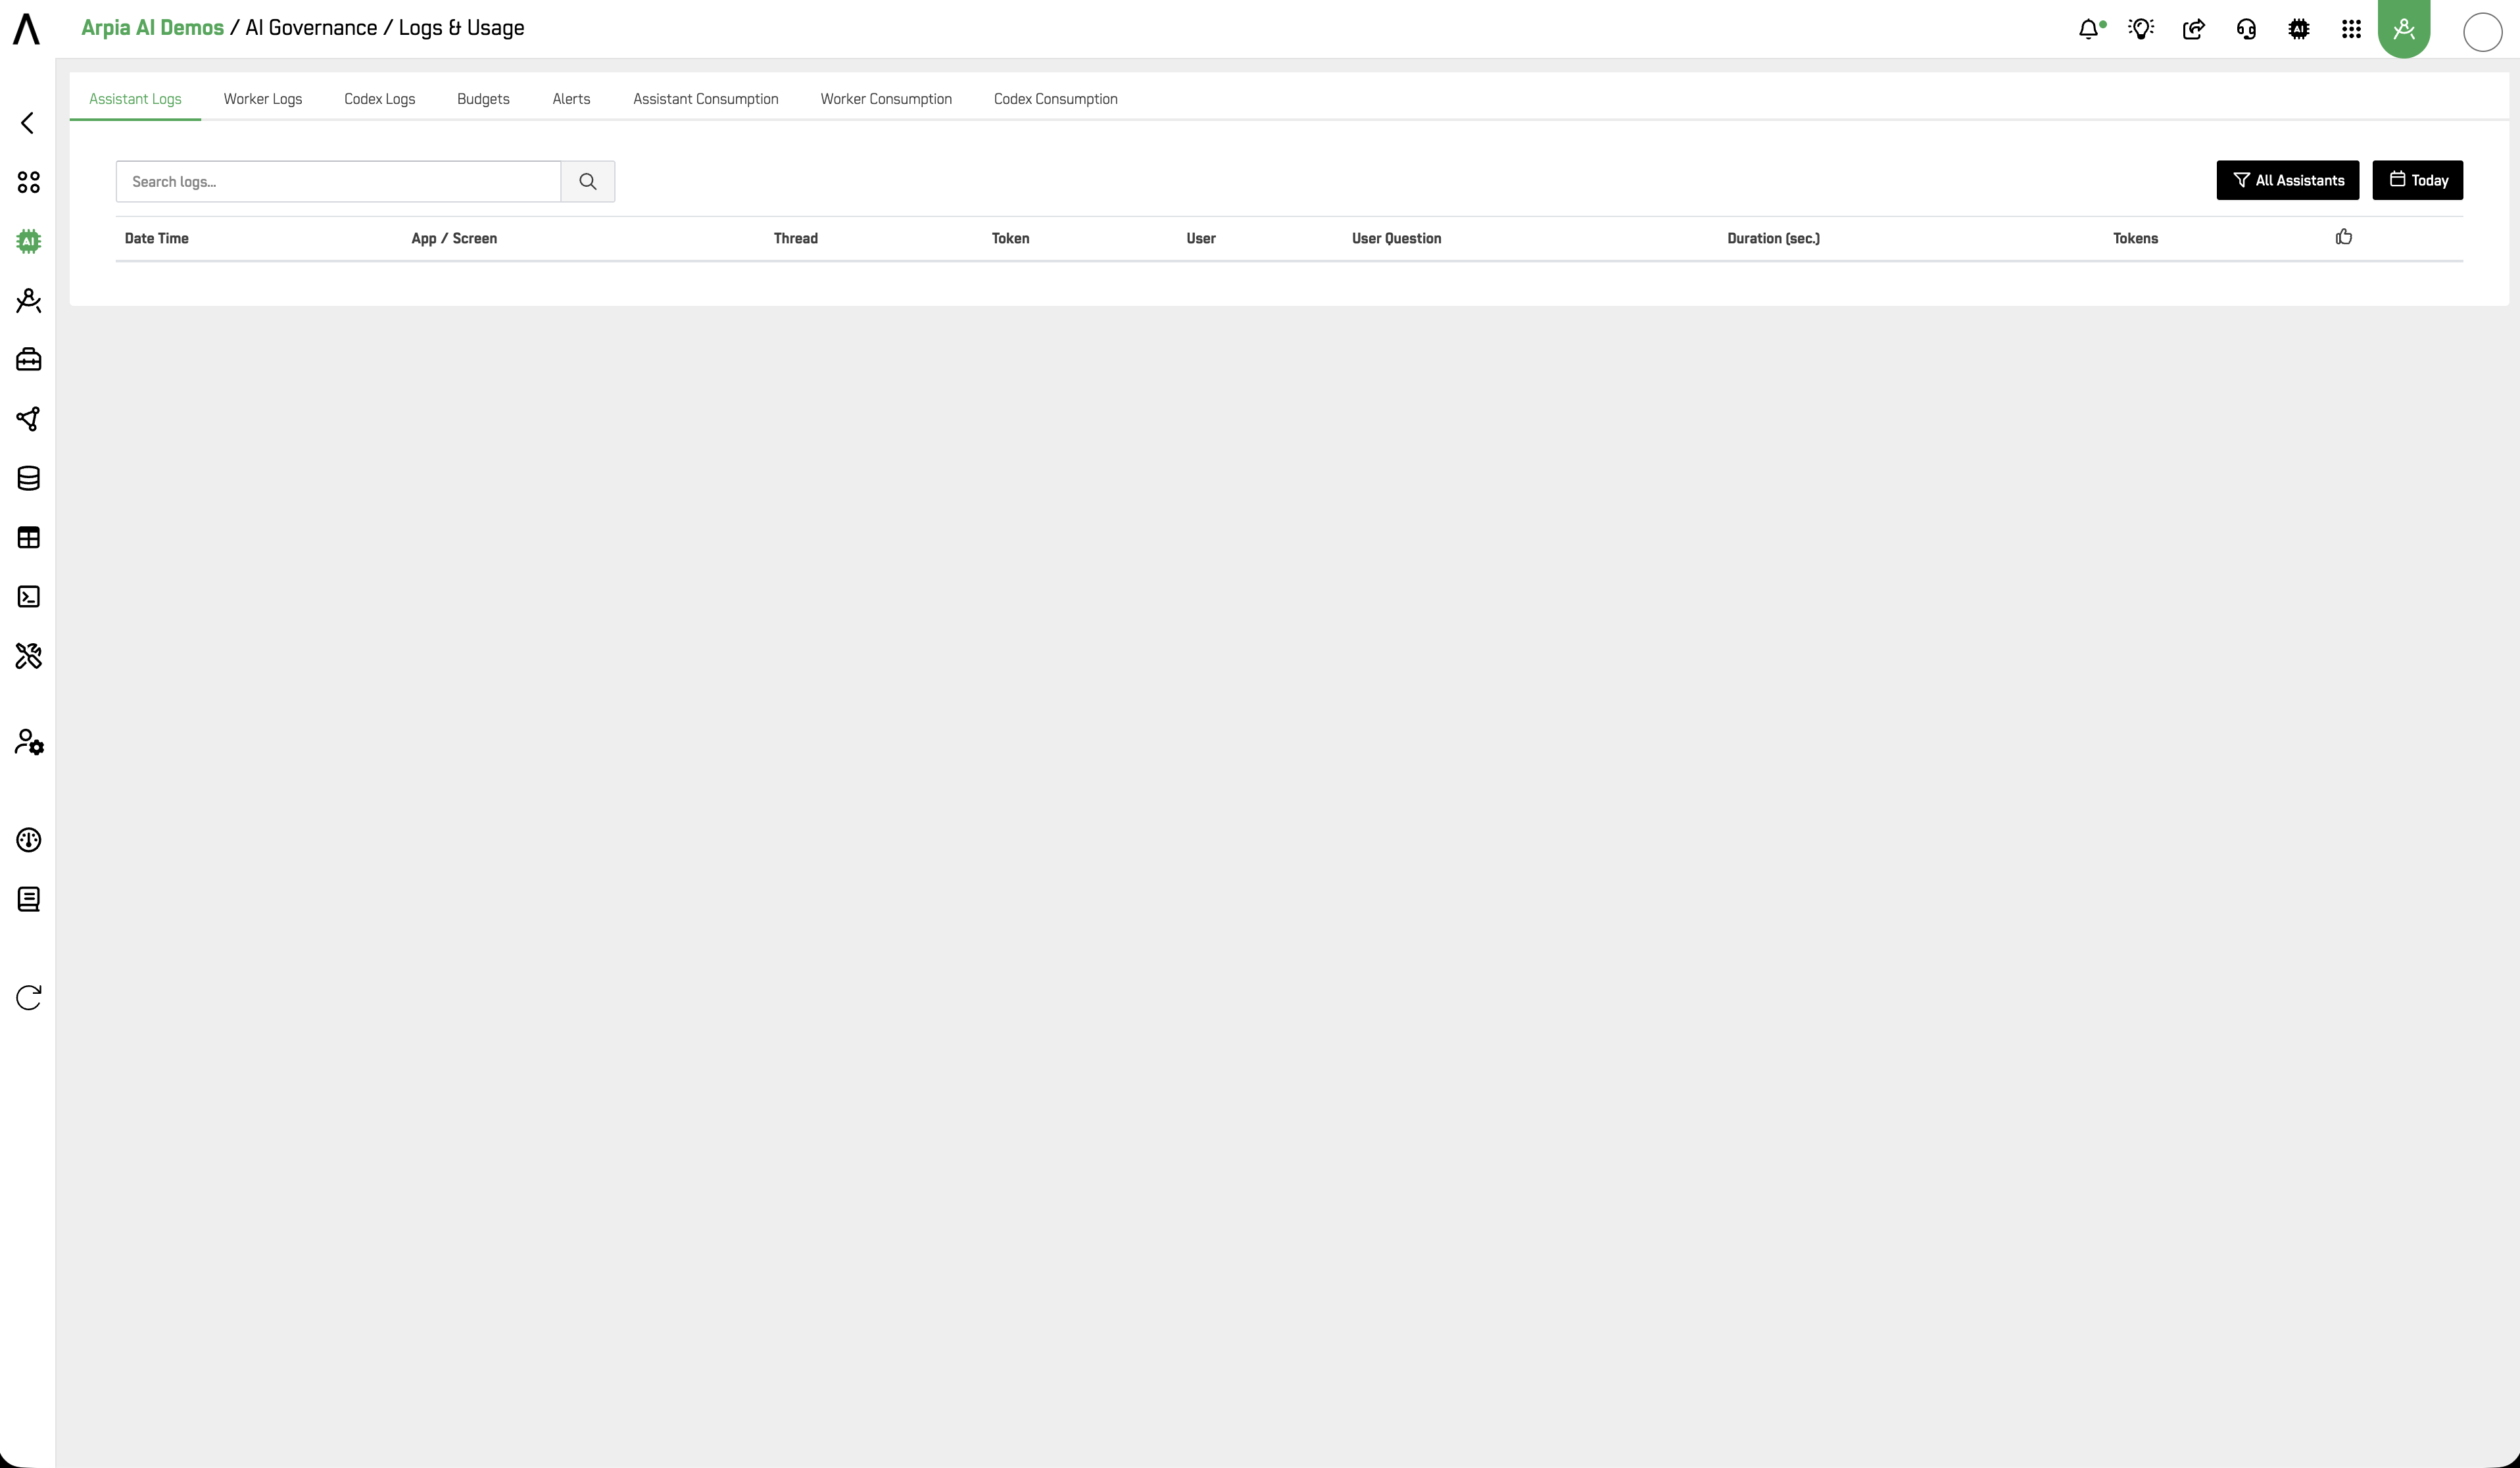
Assistant Logs
A searchable, time-filtered log of every AI Assistant interaction.
Filters: Assistant selector (All Assistants or specific assistant) · Time window (Today, Yesterday, Last 3 Days, Last 7 Days, Last 15 Days, Last 1 Month)
Table columns:
| Column | Description |
|---|---|
| Date Time | Timestamp of the interaction |
| App / Screen | The AI App and screen where the interaction occurred |
| Thread | Conversation thread identifier |
| Token | Interaction token |
| User | Email of the user who submitted the query |
| User Question | The user's input as submitted |
| Duration (sec.) | Time taken to generate the response |
| Tokens | Total tokens consumed by the interaction |
Log Detail Panel
Clicking a log row opens the AI Response Debug panel on the right, which provides a full forensic breakdown of the interaction:
- App and Screen — linked to the source assistant
- Thread, Token, Date Time, User — full interaction identifiers
- AI Platform — the provider used (e.g.
openai) - Token Usage per Model in AVU — donut chart showing AVU cost breakdown by model, with Prompt Tokens, Completion Tokens, Total Tokens, and Value Units
- User Question — the exact query submitted
- Conversation History — expandable prior conversation turns (count shown)
- Assistant Reasoning — expandable engine reasoning steps (count shown)
- Tool Executions — one panel per tool call, showing: status (✓ ok / error), tool name (e.g.
gen-query), output variable, iteration number, duration, character count, and log count - Assistant Response — the full response returned to the user, rendered with formatting
Worker Logs
A searchable, time-filtered log of all AI Worker background process executions.
Filters: Worker selector (All Workers) · Time window (same options as Assistant Logs)
Table columns:
| Column | Description |
|---|---|
| Date Time | Execution timestamp |
| Project / Worker | Project and worker name |
| Thread | Execution thread identifier |
| Rows | Number of data rows processed |
| Input Tokens | Tokens consumed as input |
| Output Tokens | Tokens generated as output |
| Total Tokens | Combined token count |
| Total Duration (sec.) | Total execution time |
A Totals row at the bottom of the table aggregates all values within the selected time window.
Codex Logs
A searchable log of all ARPIA AI Codex job executions.
Filters: Project selector (All Projects) · Time window (Today default — same options as other log tabs)
Search: by job id, session, user, or prompt
Table columns:
| Column | Description |
|---|---|
| Date Time | Job execution timestamp |
| Project | Workshop project the job belongs to |
| User | User who triggered the job |
| Model | AI model used for the job |
| User Prompt | The prompt submitted to Codex |
| Status | Job completion status |
| Iter. | Number of reasoning iterations |
| Duration (sec.) | Total job execution time |
| Tokens | Total tokens consumed |
Budgets
Set budget controls by scope and period to manage token and AVU consumption with threshold alerts.
Budgets control token and AVU consumption by scope and period, reducing cost variance and budget overrun risk.
Start with threshold alerts, then enable hard-stop once normal usage is baselined.
Affected modules: AI Assistants, AI Reasoning Objects, ARPIA AI Codex.
The Budgets table displays: Scope, Period, Token Limit, AVU Limit, Threshold %, Status.
Creating a Budget Policy
Click + Add Budget.
| Field | Description |
|---|---|
| Scope Type | Where the budget applies: GLOBAL, APP, ASSISTANT, WORKER, CODEX |
| Scope Ref | Specific asset identifier when scope is not GLOBAL |
| Period | Reset cadence: DAILY, WEEKLY, MONTHLY |
| Token Limit | Maximum tokens allowed within the period |
| AVU Limit | Maximum AVU spend allowed within the period |
| Alert Threshold % | Percentage of the limit that triggers an alert (default: 80.00) |
| Hard Stop | No (default) — alert only · Yes — block all AI requests once the limit is reached |
| Owner User | Accountable owner for this budget policy |
| Status | ACTIVE or INACTIVE |
Enable Hard Stop only after baselining normal usage. Premature hard stops can block production AI assistants mid-interaction.
Alerts
Track governance events and operational anomalies. Acknowledge and resolve alerts as part of incident hygiene.
Alerts provides governance event visibility and operational response tracking through alert states and ownership actions.
Use alerts as early indicators and escalate unresolved high-risk events to incidents.
Affected modules: AI Assistants, AI Reasoning Objects, ARPIA AI Codex.
The Governance Alerts table displays: Type, Title, Severity, Status, Triggered.
Alerts are generated automatically by the platform when governance thresholds are crossed — including budget threshold breaches, moderation triggers, provider degradation events, and policy violations. Use Refresh to reload the queue with the latest alerts.
Assistant Consumption
An analytics dashboard for AI Assistant performance and usage — identical in structure to the AI Assistants tab in the AI Governance Overview, but accessible directly within Logs & Usage for cross-tab workflows.
KPI cards:
- Quantity of Answers — total responses generated
- Answers Efficiency — percentage of responses meeting quality threshold
- Answering Duration — Avg / Max / Min response time
Charts:
- Assistant Responses — donut chart of response volume by assistant
- Assistant Tokens Usage — donut chart of token consumption by assistant
- Response and token bar charts over time by assistant
AI Providers Status panel — real-time provider health for Anthropic, Lambda, OpenAI, and others, with last check time and status (OK / Minor / Major).
Worker Consumption
An analytics dashboard for AI Worker background process performance.
KPI cards:
- Quantity of Logs — total worker execution logs
- Answering Duration — Avg / Max / Min execution time
Charts:
- Log Responses — breakdown by AI Worker
- Tokens Usage — token consumption by AI Worker
AI Providers Status panel — same real-time provider health view as Assistant Consumption.
Codex Consumption
An analytics dashboard for ARPIA AI Codex job performance and cost.
KPI cards:
- Quantity of Jobs — total jobs executed
- Success Rate — percentage of successful completions
- Total Tokens — aggregate token consumption
- Iterations — Avg / Max reasoning iterations
Job Duration — Avg / Max / Min job execution time
Charts:
- Codex Jobs — job volume by project
- Tokens Usage — token consumption by project
- Top Users by Jobs — ranking of users by job submission volume
- AVU Cost by Model — cost breakdown in AVU (ARPIA Value Units) by model
Governance Best Practices
Use threshold alerts before hard stops. Set budgets at 80% alert threshold with Hard Stop = No first. Monitor for 2–4 weeks to establish baselines. Only enable Hard Stop once you understand normal consumption patterns.
Treat unresolved alerts as pre-incidents. An alert that remains unacknowledged for more than 24 hours should be escalated to an Incident in Risk & Compliance. This creates the audit chain required under SOC 2 CC7.3 and ISO 42001 Clause 10.1.
Search logs before opening incidents. The User Question field in Assistant Logs and the User Prompt field in Codex Logs are your first forensic tools. Search for the interaction that triggered a governance concern before escalating.
Cross-reference Provider Status with efficiency drops. If Answers Efficiency drops on the Assistant Consumption dashboard, check AI Providers Status immediately. A provider Minor or Major event is the most common root cause and does not require an incident — but should be noted in Alerts.
Framework Alignment
| Framework | Relevant Controls |
|---|---|
| SOC 2 Type II | CC7.2 (system monitoring), CC7.3 (incident response), CC4.1 (monitoring activities) |
| ISO 42001 | Clause 9.1 (monitoring & measurement), Clause 8.5 (AI system operation logs) |
| NIST AI RMF | MEASURE 2.5 (AI risk monitoring), GOVERN 1.4 (organizational risk tolerance) |
| EU AI Act | Article 12 (record-keeping and logging), Article 9 (risk management system) |
| ISO 27001 | A.12.4 (logging and monitoring), A.16.1 (incident management) |
Related
- AI Governance — AI Governance section overview
- Overview — aggregate metrics dashboard
- Risk & Compliance — incidents, risk register, and control reviews
- Policy Center — governance policy definitions
Updated about 1 month ago