
Data Governance - Data Quality
Data Quality Metrics are critical indicators used in assessing the condition and effectiveness of data within an organization. These metrics provide a quantitative basis for evaluating the health of data across various dimensions, such as accuracy, completeness, consistency, and timeliness. Understanding and actively managing these metrics is fundamental for ensuring that data meets the standards required for operational processes, analytics, and decision-making.
-
✅ Accuracy: This metric measures the correctness and precision of data in comparison to real-world values or verified sources of truth. Accuracy metrics help identify errors like incorrect data entries, misspellings, and outdated information. For instance, in a customer database, accuracy would involve checking that addresses, names, and contact details are correct as per the latest available information.
-
🧩 Completeness: Completeness metrics evaluate whether all expected data is present in the dataset. They identify missing values or records that are expected but absent. Completeness is critical in scenarios like regulatory reporting where missing data can lead to non-compliance, or in customer service where incomplete client profiles can affect service quality.
-
🔄 Consistency: Consistency metrics check for uniformity and logical coherence of data across different datasets or within the same dataset over time. This includes verifying that data formats and values follow predefined norms across different data stores, ensuring that there are no contradictory records within a dataset. An example would be ensuring that all dates in a transaction log use the same format and that account balance figures align across transaction and summary tables.
-
⏱️ Timeliness: Timeliness measures the delay between the occurrence of an event and the representation of that event in the database. This metric is essential in environments where real-time or near-real-time data is crucial, such as in monitoring systems, where delays in data updates can lead to missed opportunities or risk incidents.
-
🔒 Reliability: This metric assesses the extent to which data is consistent and correct across multiple sources and over time. It helps gauge the trustworthiness of data sources and the processes used to collect, store, and manage data.
-
🧩 Uniqueness: Uniqueness metrics are used to detect and prevent duplicate entries in data tables. Ensuring that each record is unique where required (such as a user ID or email address in a user account table) is crucial for maintaining data integrity.
-
✔️ Validity: Validity metrics check data against relevant rules and constraints to ensure it conforms to specific syntax (format, type, range) and semantics (meaning and business rules). For example, a validity check might confirm that postal codes match the format and location appropriate to a country or region.
-
🔗 Integrity: Data integrity metrics focus on the correctness and completeness of relationships within data, such as foreign keys and other constraints that maintain the logical relationships between tables.
Managing these metrics typically involves routine data quality assessments, using tools that automatically measure and report on these dimensions. Organizations often implement dashboards and alerts to monitor data quality metrics continuously, allowing for prompt detection and correction of data quality issues. High data quality across these dimensions ensures robust analytics, accurate reporting, enhanced customer satisfaction, improved decision-making, and overall operational efficiency.
On AP, the platform features Data Profiling for each Column contained in the Knowledge Node. In the following image, we can see the Data Profile tab within the settings of a Node:
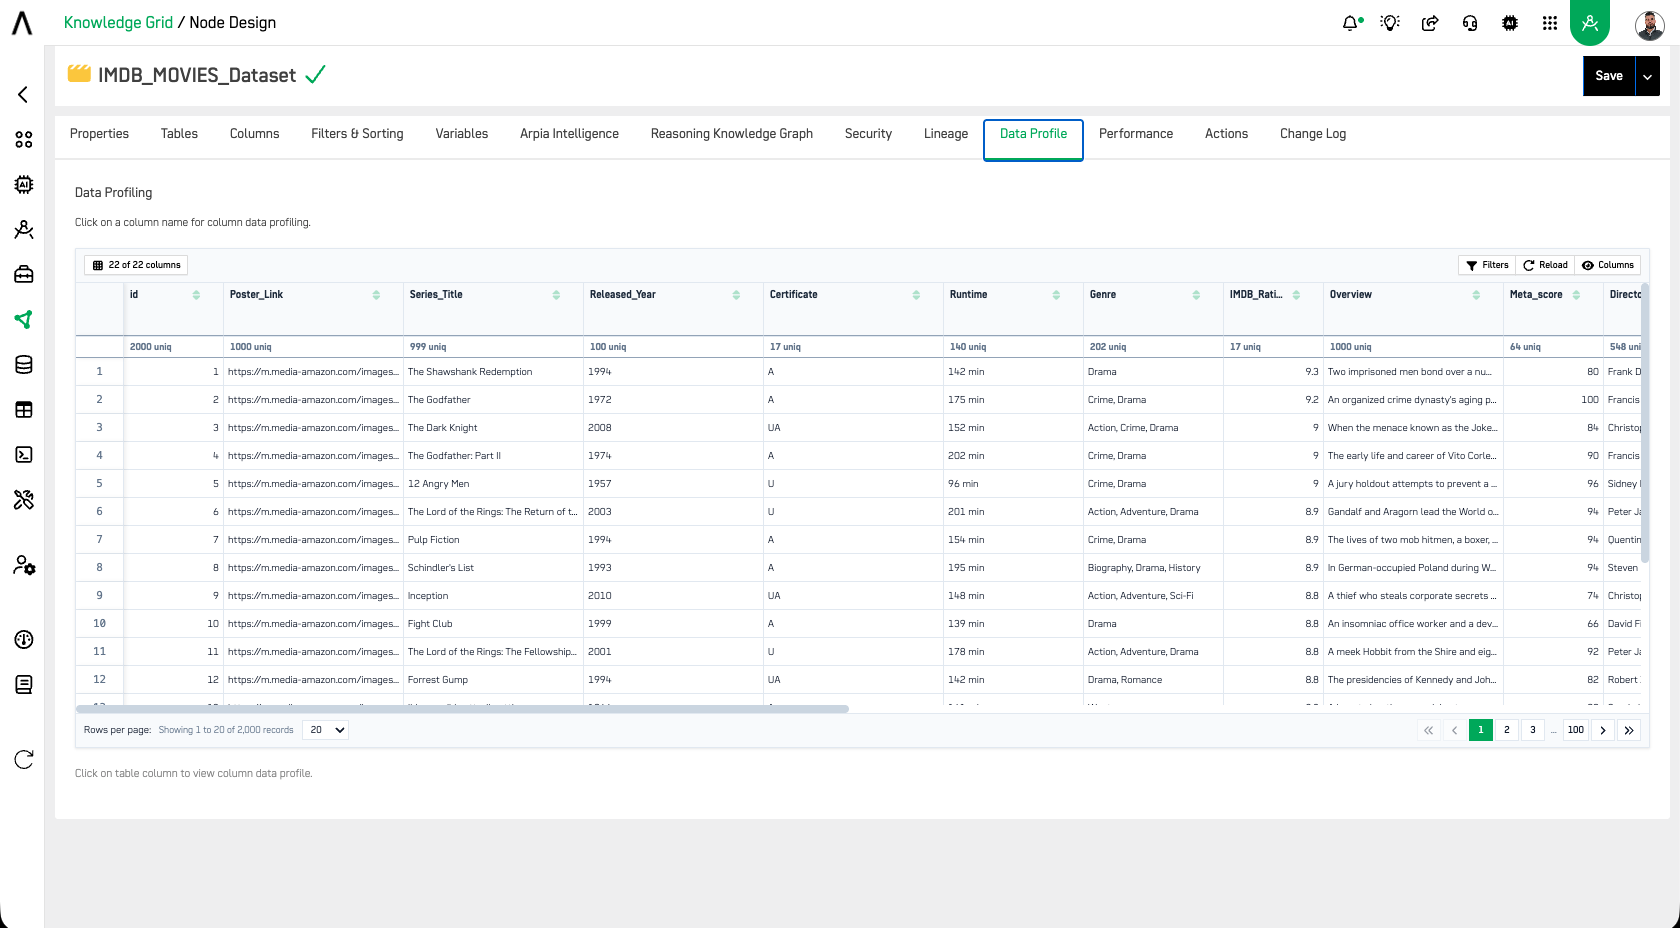
Here, you can analyze each column by selecting it. For example, if we data profile the Status column, the data profile will display as follows:
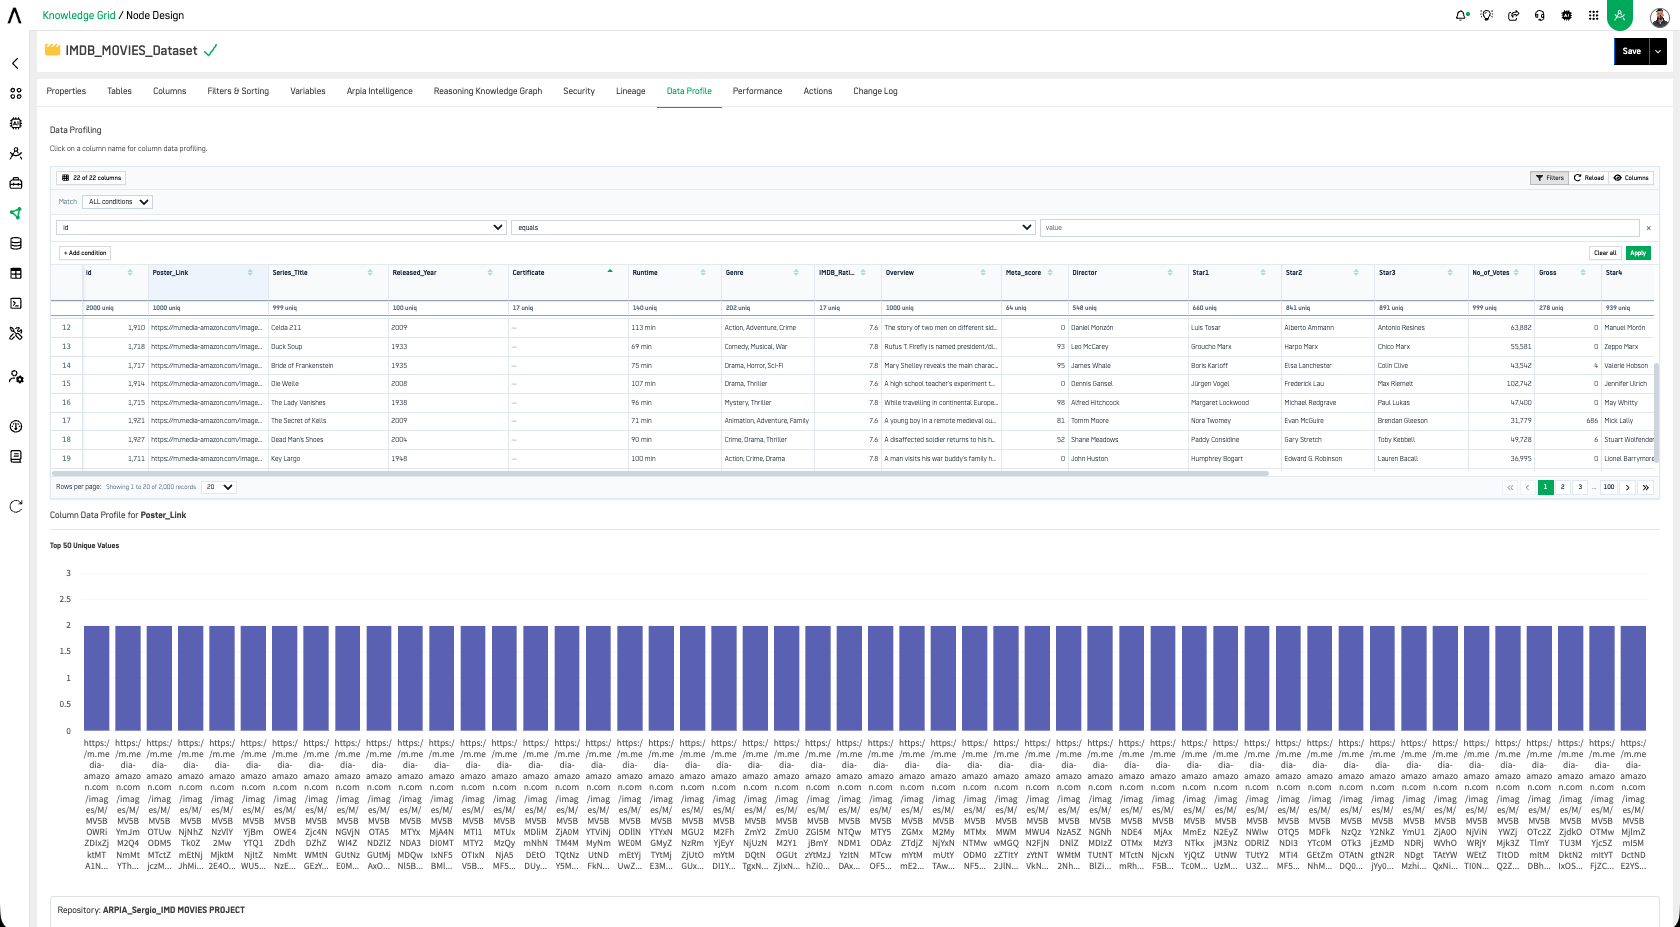
This tool provides data profiling for columns, which is useful for data quality validations and more.
🏛️ Compliance Framework Alignment
Maintaining high data quality directly supports the following compliance frameworks:
| Requirement | ISO 42001 | SOC 2 Type 2 | ISO 27001 | GDPR | HIPAA | NIST AI RMF | DORA |
|---|---|---|---|---|---|---|---|
| Accuracy & validity of data | ✅ | ✅ | ✅ | ✅ | ✅ | ✅ | ✅ |
| Completeness of records | ✅ | ✅ | ✅ | ✅ | ✅ | ✅ | |
| Consistency across data stores | ✅ | ✅ | ✅ | ✅ | ✅ | ✅ | |
| Timeliness of data updates | ✅ | ✅ | ✅ | ✅ | |||
| Data integrity & uniqueness | ✅ | ✅ | ✅ | ✅ | ✅ | ✅ | ✅ |
| Data profiling & quality monitoring | ✅ | ✅ | ✅ | ✅ | ✅ | ✅ | ✅ |
Why Data Quality Supports Each Framework
🤖 ISO 42001 — AI Management System
ISO 42001 requires that data used to train, validate, and operate AI systems meets defined quality standards. Poor quality data introduces bias, inaccuracy, and unreliable AI outputs. ARPIA's column-level data profiling allows organizations to validate the accuracy, completeness, and uniqueness of data before it feeds AI processes, supporting the standard's requirements for data governance in AI pipelines.
🔐 SOC 2 Type 2 — Security, Availability, and Confidentiality
SOC 2 auditors assess whether data processing is reliable and consistent over time. Data quality metrics — particularly accuracy, consistency, and timeliness — provide evidence that the platform's data processing meets the availability and processing integrity trust service criteria. ARPIA's data profiling tools produce verifiable, column-level quality records that support audit evidence packages.
🛡️ ISO 27001 — Information Security Management
ISO 27001 requires that information assets are managed with integrity. Data quality controls ensure that information remains accurate, complete, and consistent across its lifecycle, directly supporting Annex A controls related to information integrity and asset management.
🇪🇺 GDPR — General Data Protection Regulation
GDPR's Article 5 explicitly requires that personal data be accurate and kept up to date, with reasonable steps taken to erase or rectify inaccurate data. ARPIA's data profiling capabilities — including null counts, distinct value analysis, and column-level completeness metrics — give organizations the tools to identify and correct inaccurate or incomplete personal data, supporting both accuracy and storage limitation principles.
🏥 HIPAA — Health Insurance Portability and Accountability Act
HIPAA requires covered entities to maintain the integrity of Protected Health Information (PHI), ensuring it is not altered or destroyed in an unauthorized manner. Data quality controls, particularly integrity and uniqueness metrics, provide the technical safeguards required under the HIPAA Security Rule to detect and prevent unauthorized or erroneous modifications to PHI.
🧭 NIST AI RMF — AI Risk Management Framework
The NIST AI RMF's MEASURE function requires organizations to quantify data and model quality as part of AI risk management. ARPIA's data profiling tools directly support this by providing measurable, column-level statistics — including accuracy, completeness, and distribution analysis — that can be used to assess and document data fitness for AI use.
⚡ DORA — Digital Operational Resilience Act
DORA requires financial entities to ensure the integrity and availability of data supporting critical ICT processes. Data quality metrics — particularly completeness, consistency, and timeliness — provide assurance that operational data remains reliable during and after disruption events, supporting DORA's requirements for ICT resilience and data integrity testing.
Updated about 1 month ago