
App Screens
📱 Introduction to Screens in DataApps
Screens represent individual interfaces or views within a DataApp. Each screen is designed for specific tasks, such as visualizing data, submitting forms, or navigating between functionalities. These screens include a range of interactive elements—such as forms, charts, buttons, and tables—organized to facilitate user interaction.
🎨 Characteristics of a Screen in a DataApp:
- Purposeful Design: Each screen serves a specific function, like data entry, visualization, or workflow automation.
- Interactive Elements: Screens feature components like input fields, buttons, and dynamic charts for user interaction.
- User Navigation: Screens enhance the user experience with navigation controls for seamless movement between different parts of the DataApp.
- Customization: Screens can be customized using no-code tools or advanced coding for more personalized functionalities.
- Data Integration: Screens connect to Nodes to display real-time data, allowing users to interact with and analyze data directly within the application.
🖥️ Types of Screens
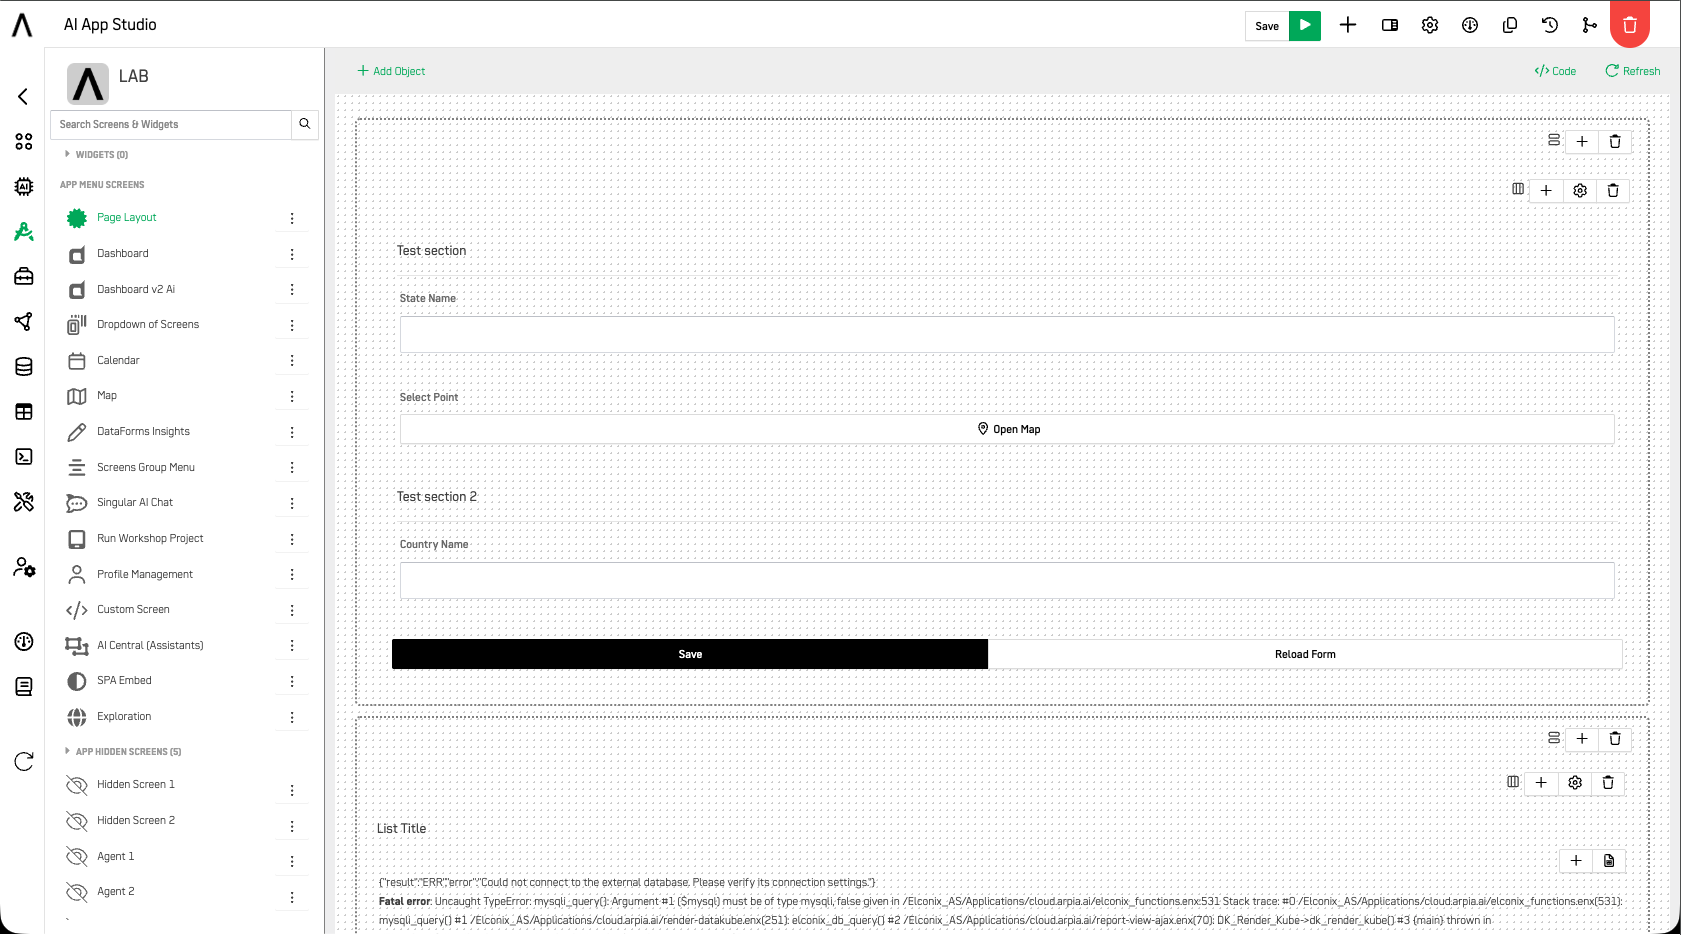
Page Layout
The Page Layout screen enables users to create custom layouts by dividing the screen into 12 columns and adding rows. This provides flexibility for users to organize elements in a structured way that suits their needs.
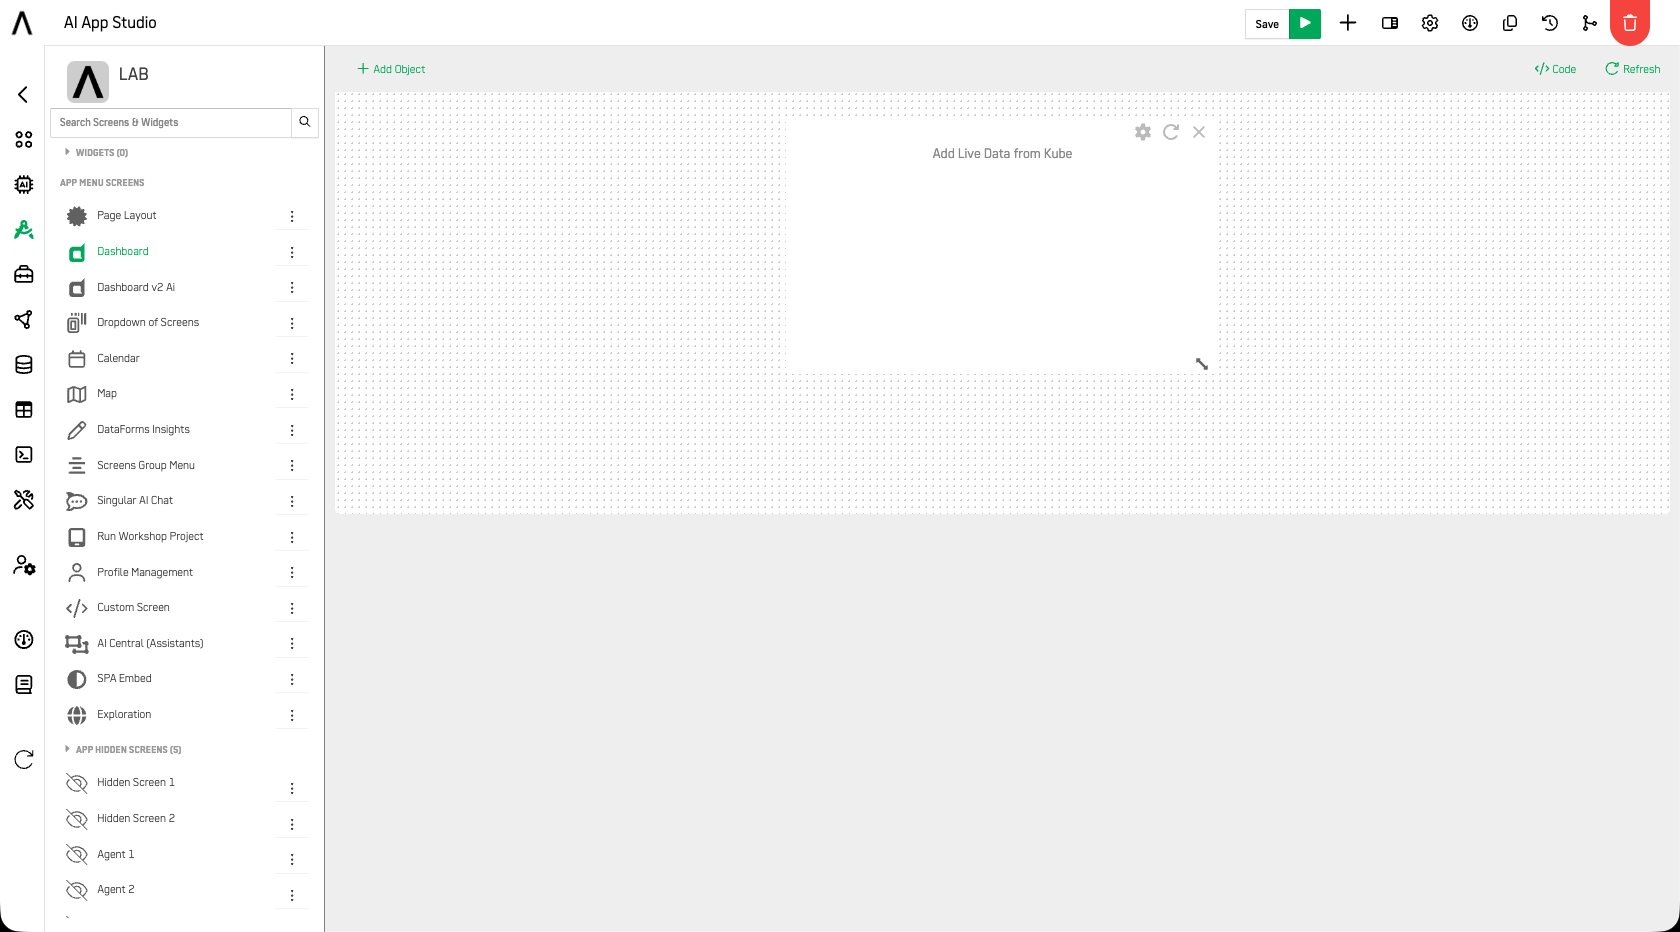
Dashboard
The Dashboard screen provides customizable dashboards based on pre-configured Knowledge Nodes in the Data App Studio. Dashboards offer a succinct view of key data, enabling users to make informed decisions quickly.
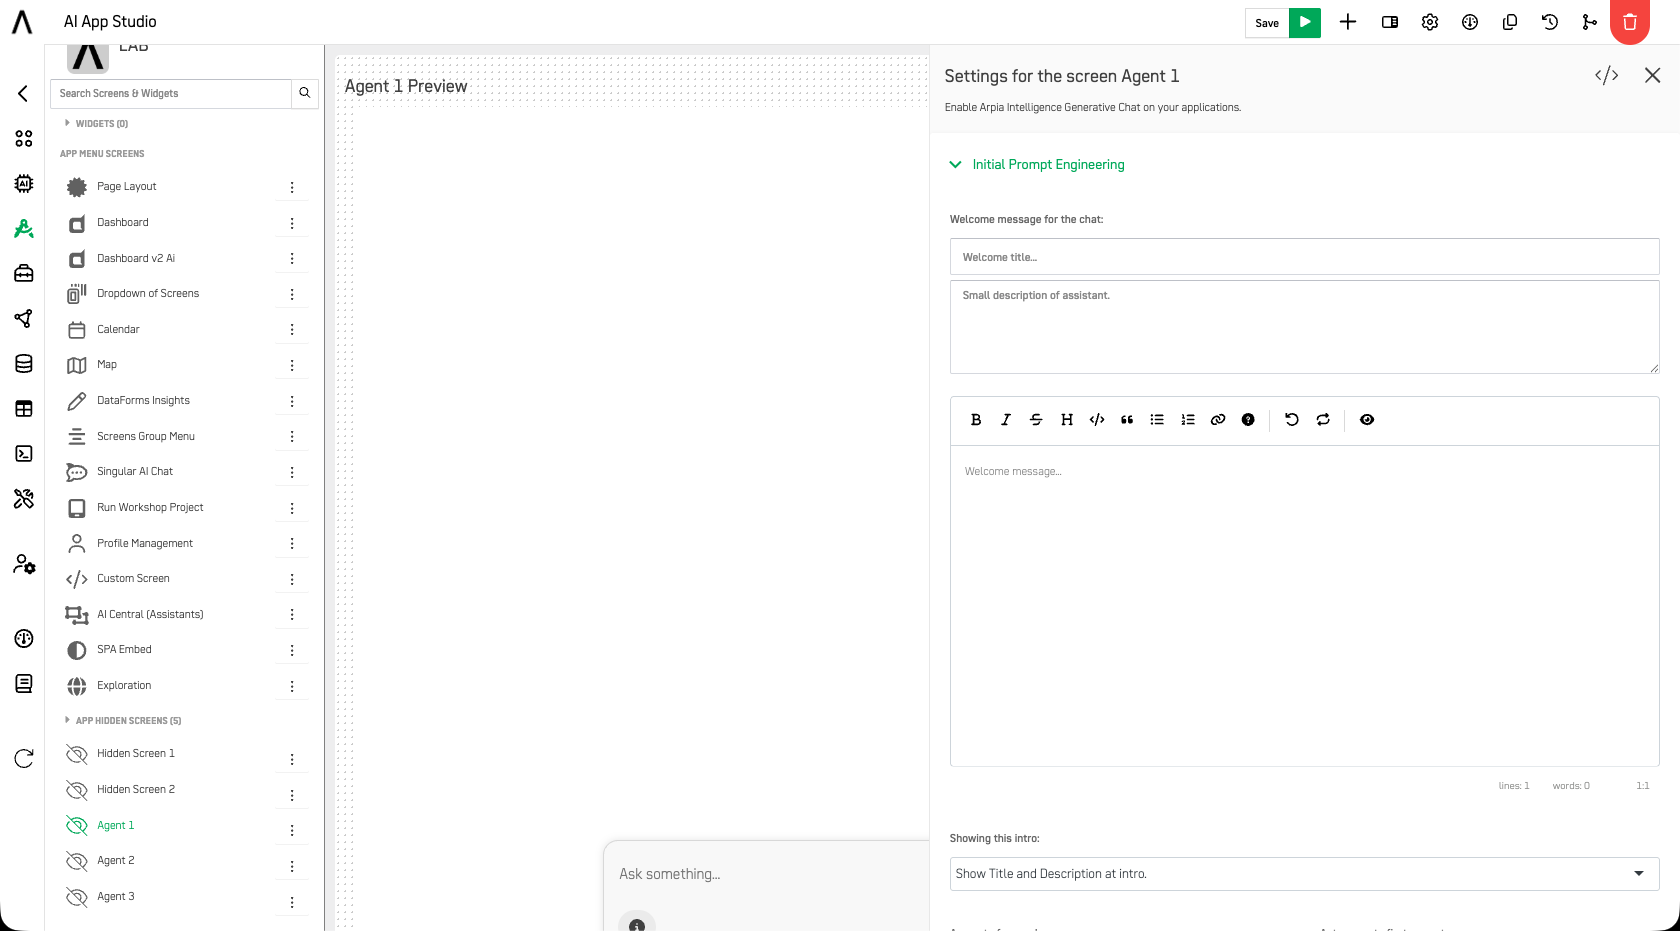
AI Assistant
The AI Assistant screen provides an interface to interact with AI-driven workflows and assistants, allowing users to query data, generate insights, or automate tasks directly within the DataApp.
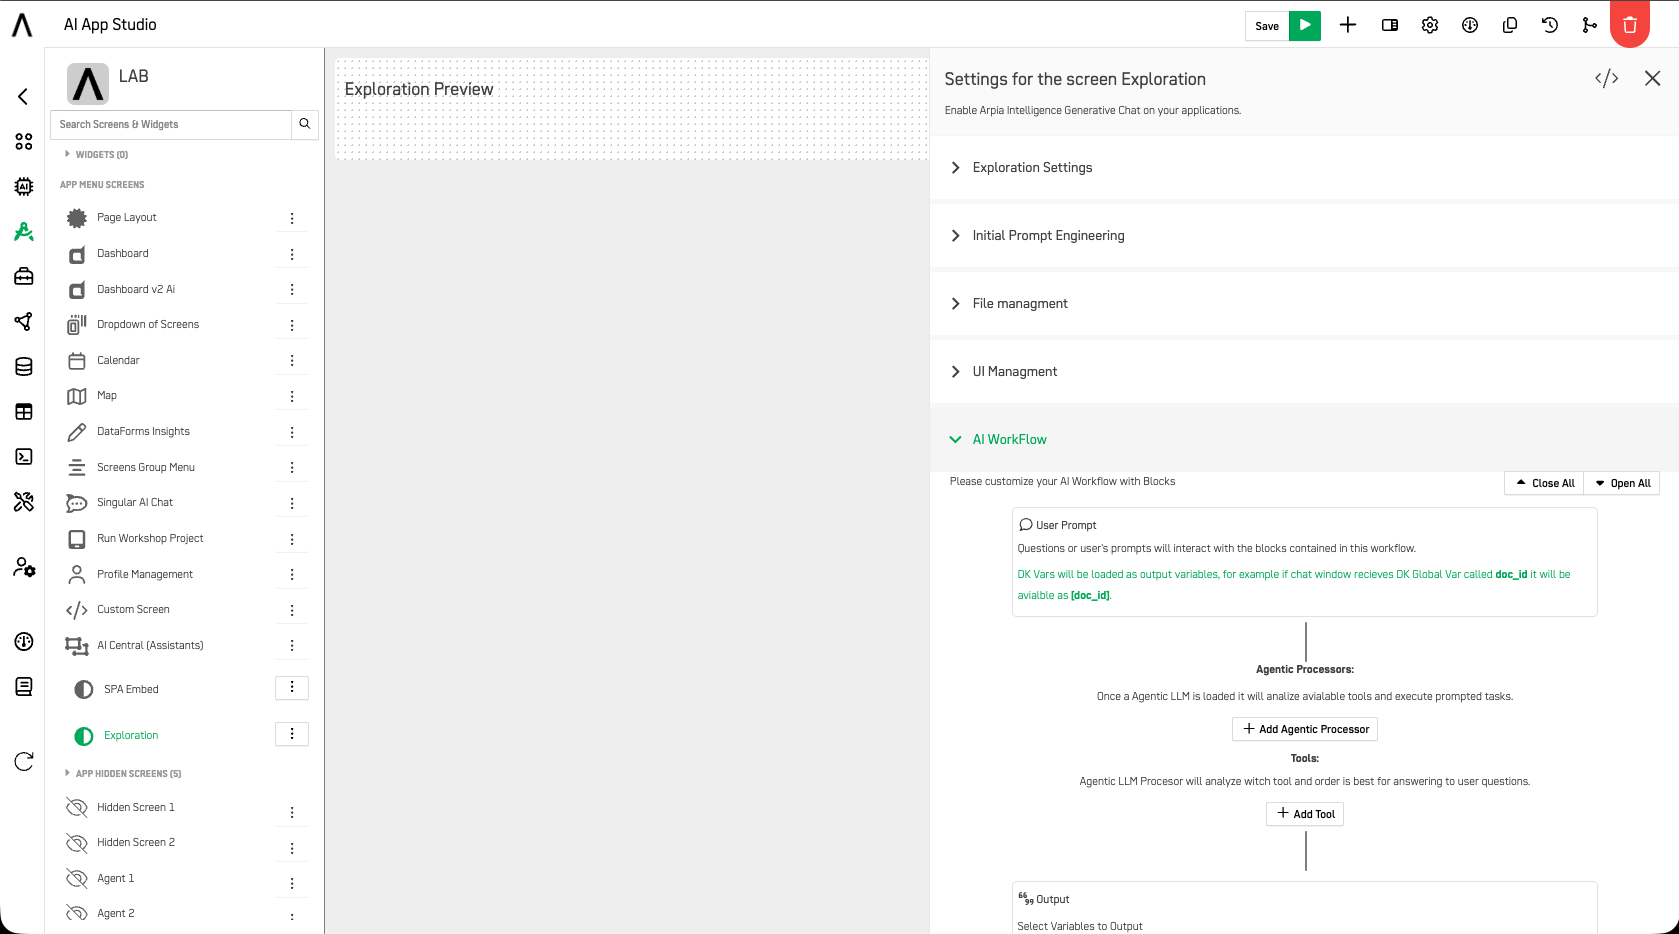
Exploration
The Exploration screen enables Arpia Intelligence Generative Chat on your applications, providing a configurable AI assistant interface that users can interact with directly within the DataApp.
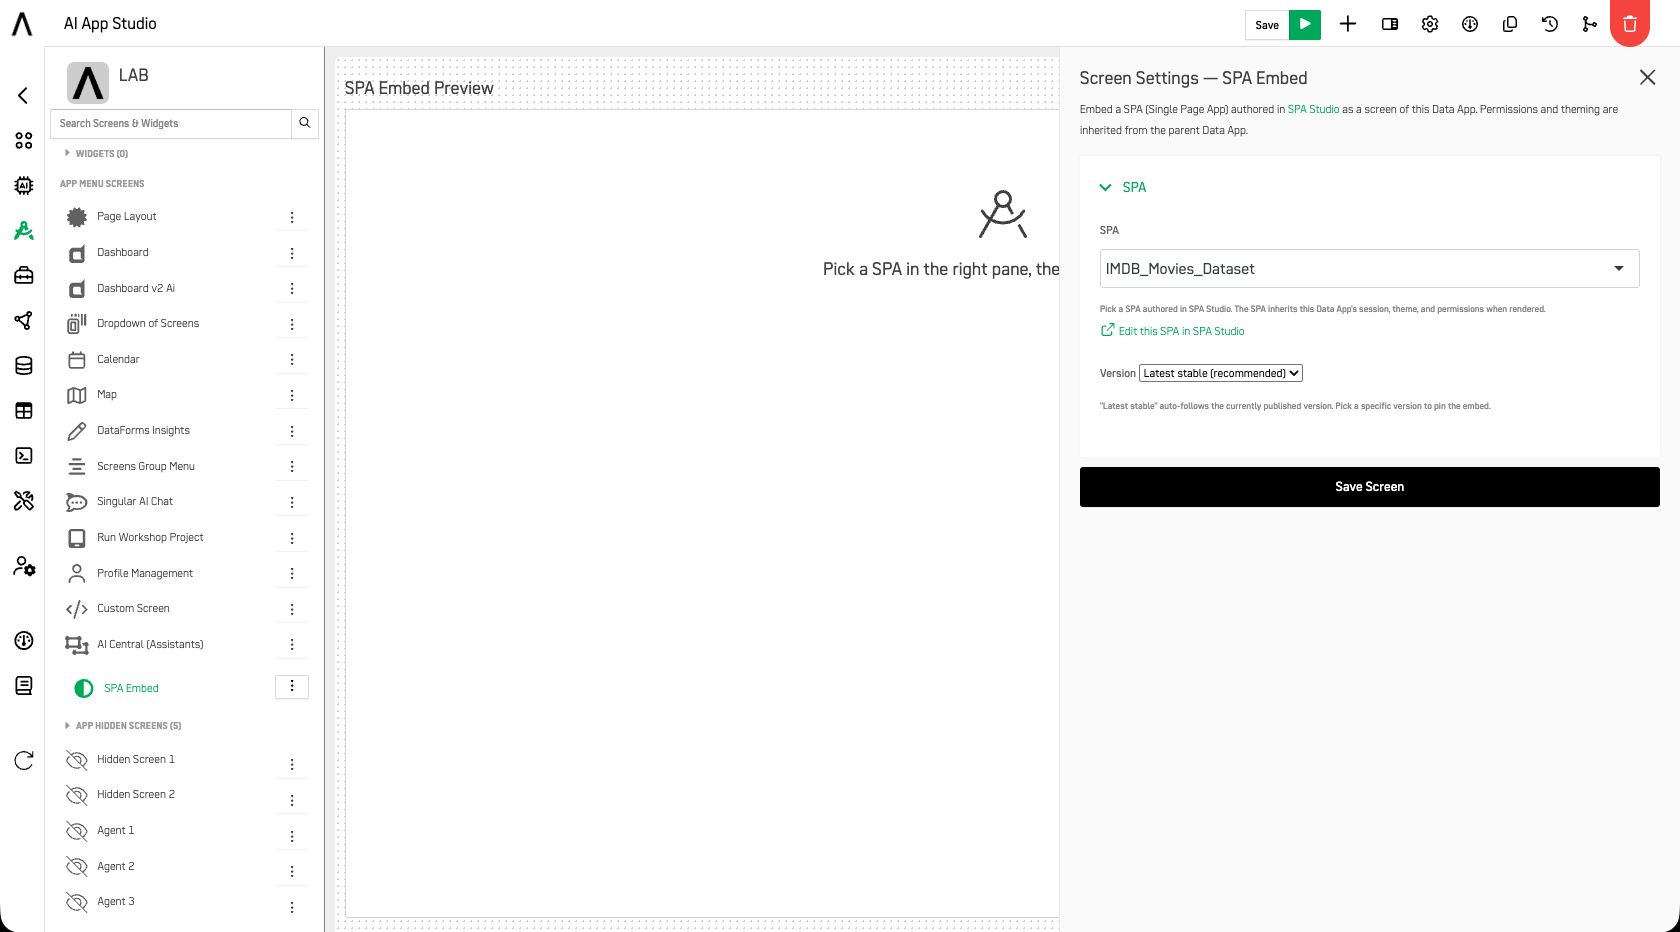
SPA Embed
The SPA Embed screen embeds a Single-Page Application (built in SPA Studio) directly as a screen inside your DataApp, so a custom app runs alongside your other screens.
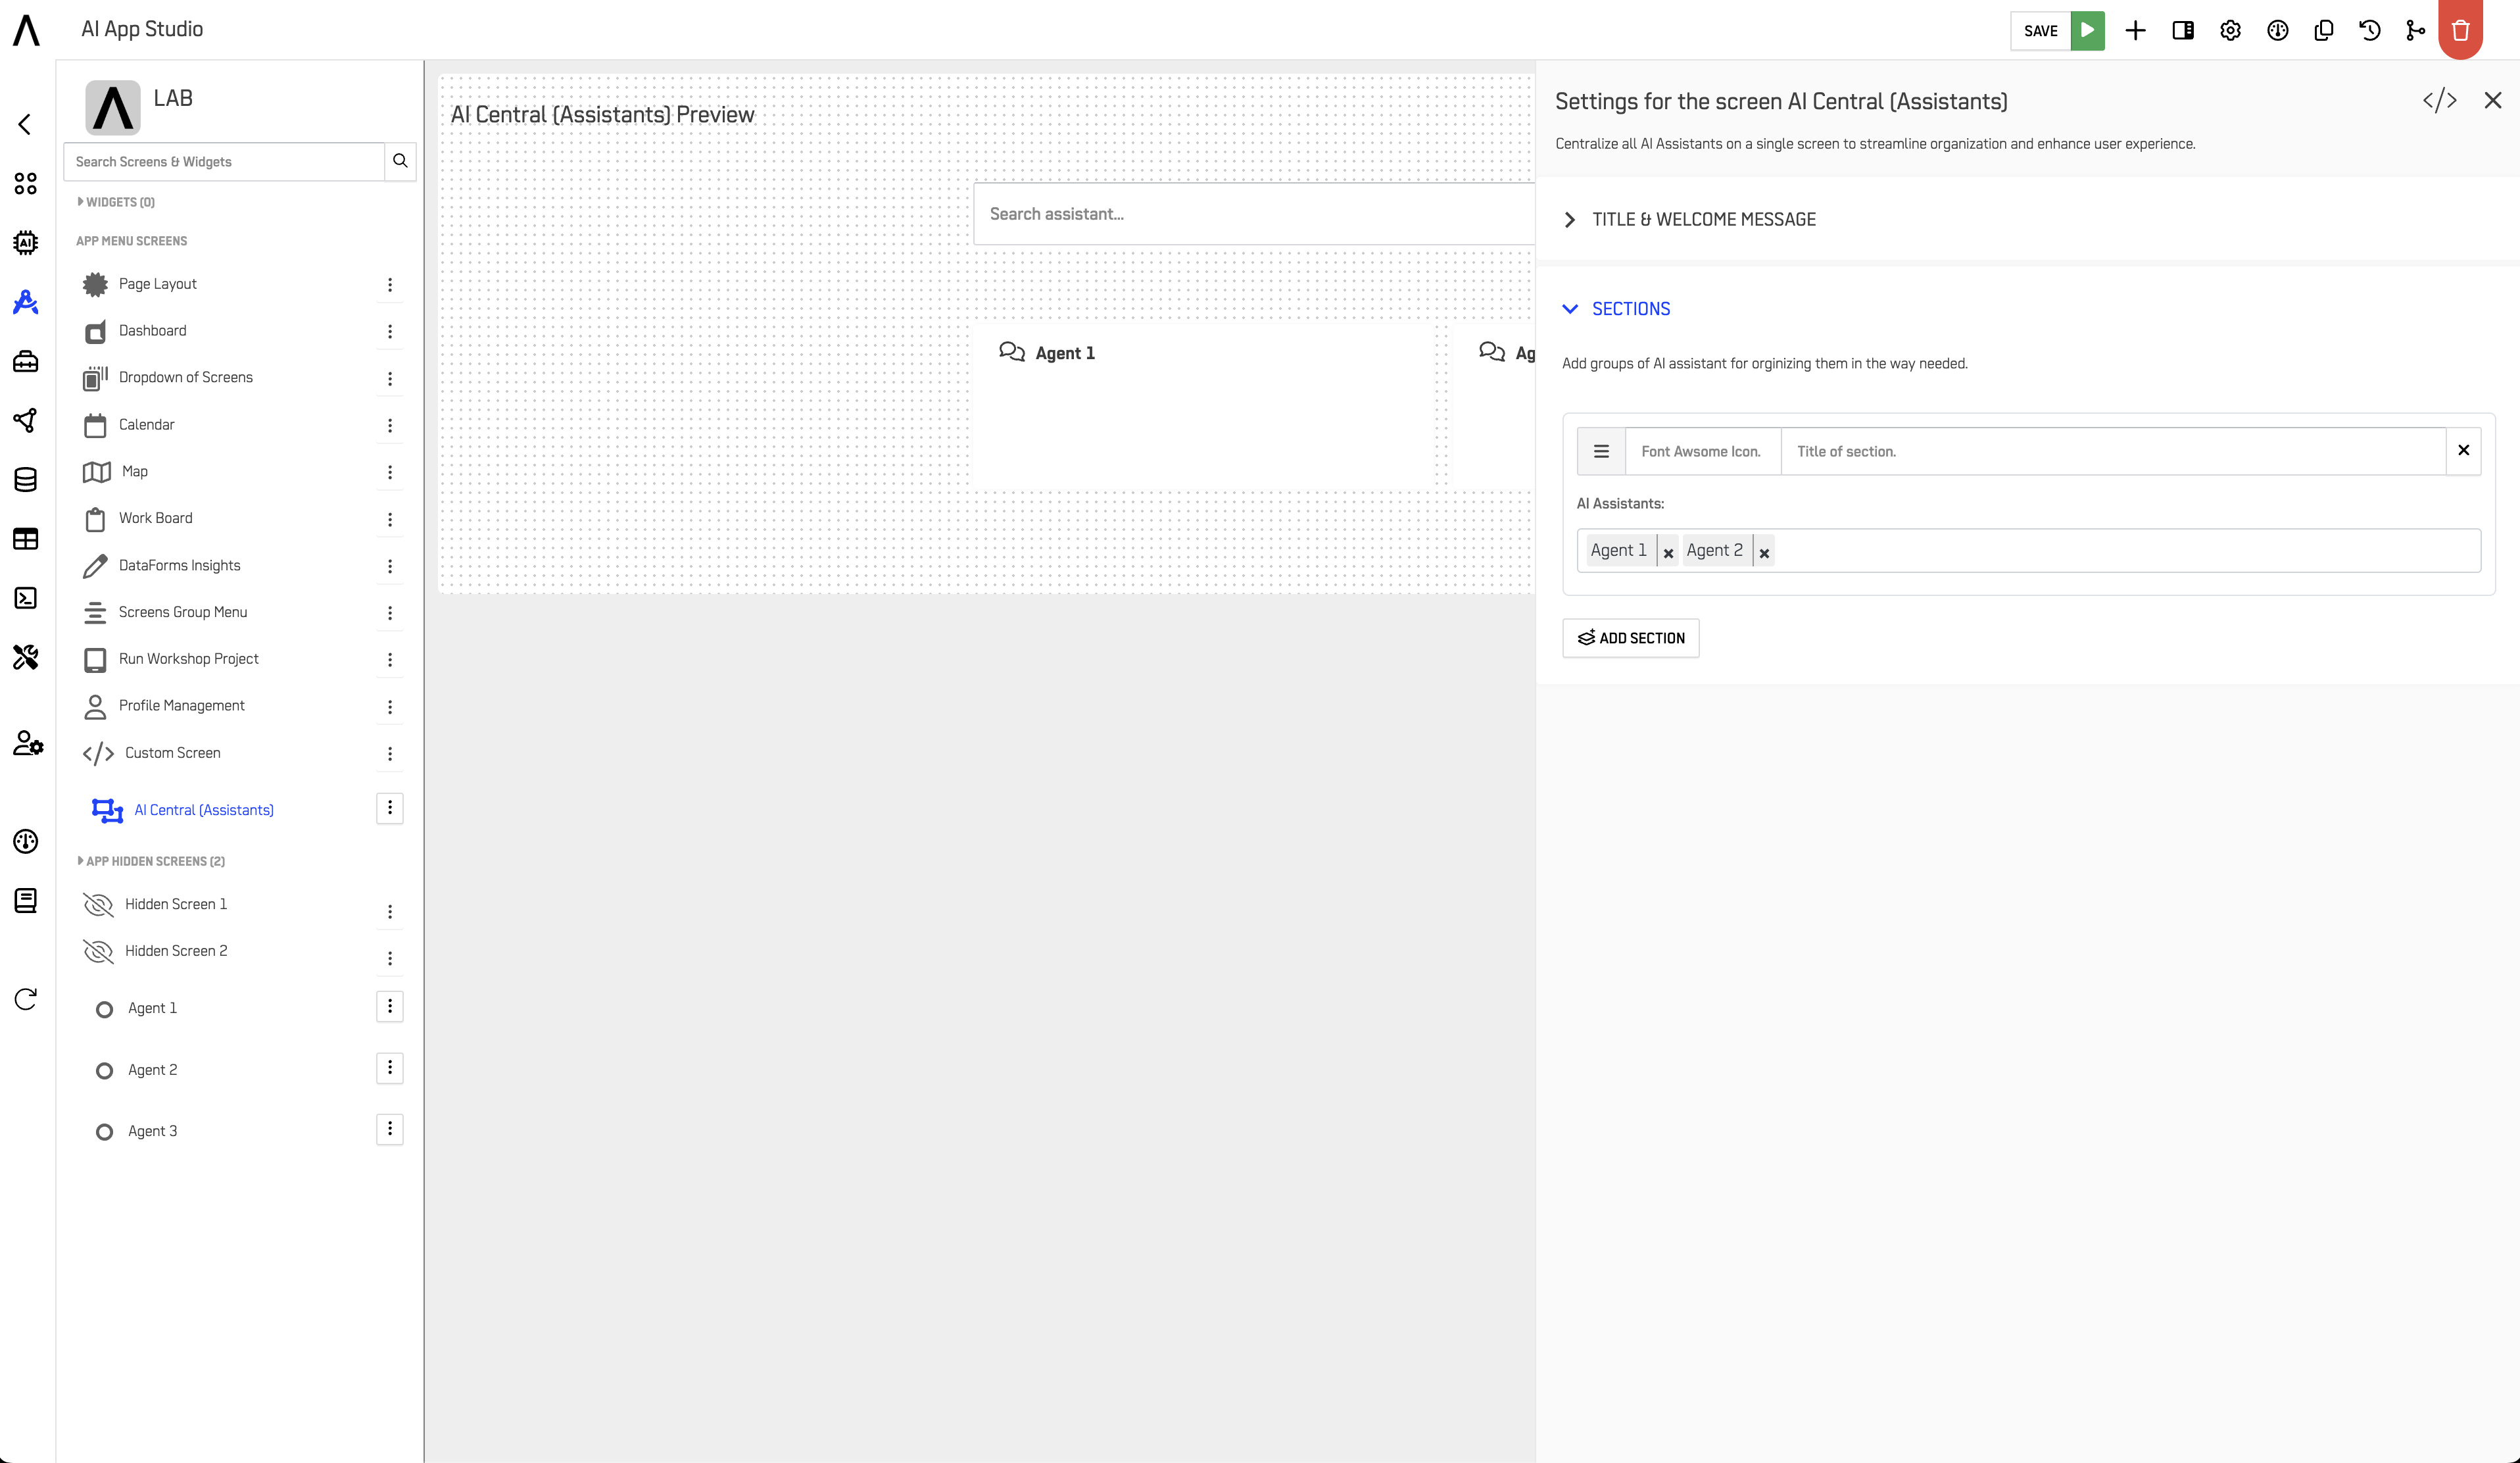
AI Central (Assistants)
The AI Central screen serves as the hub for managing all AI assistants and reasoning flows within a DataApp, allowing users to launch, monitor, and connect multiple assistants in one place.
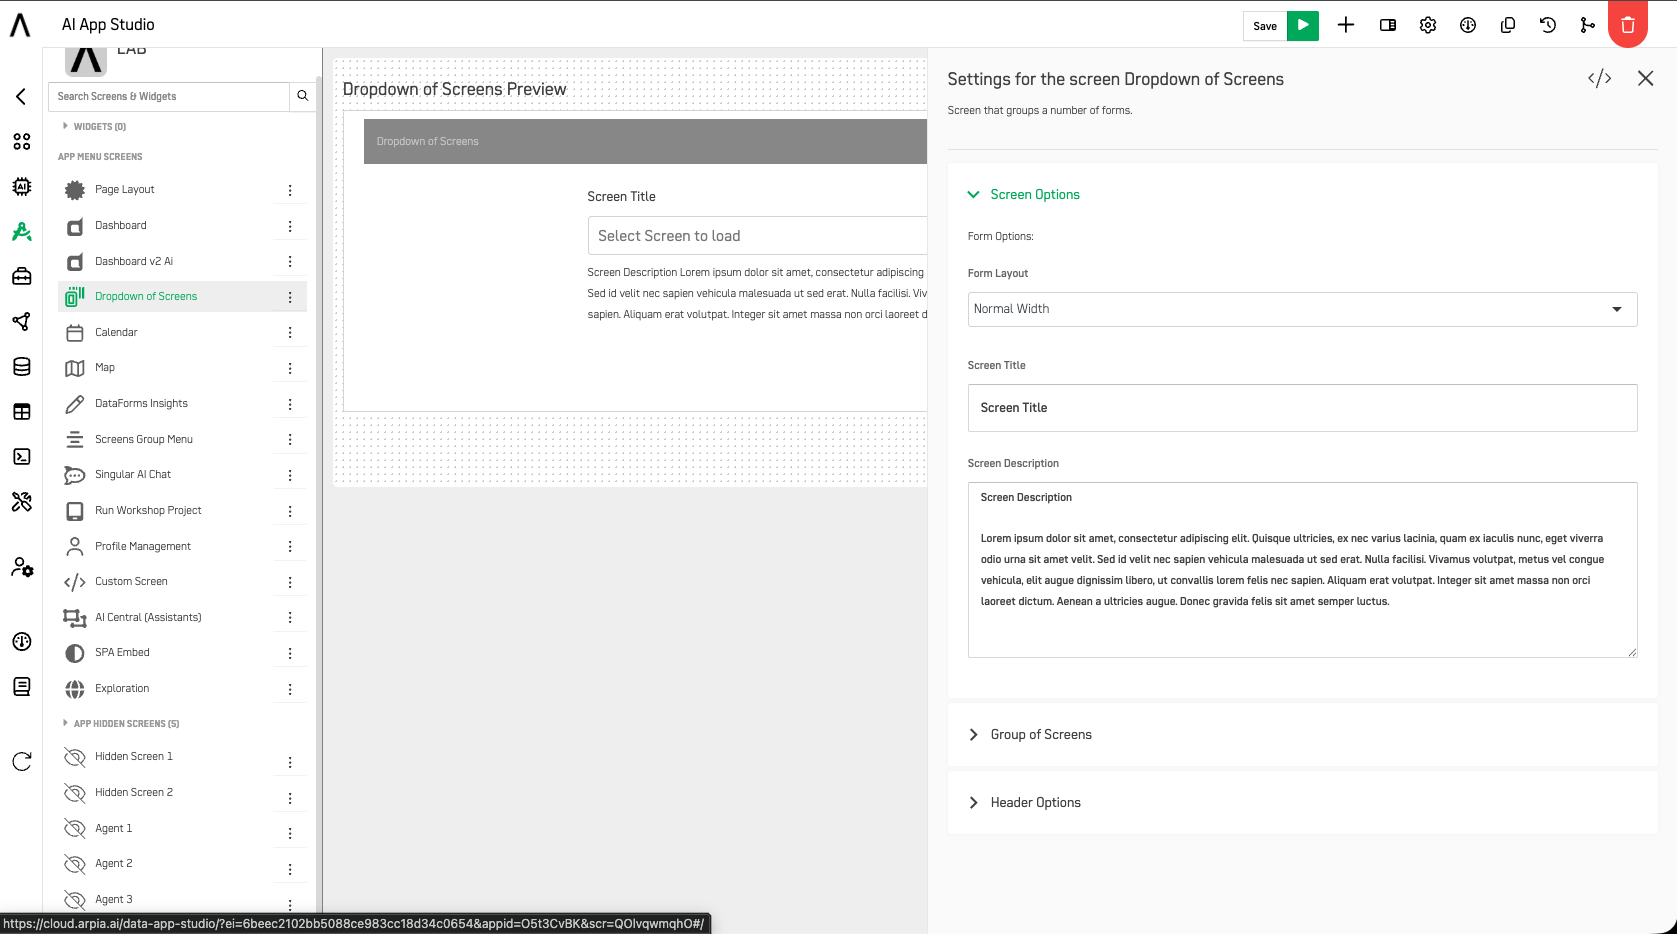
Dropdown of Screens
The Dropdown of Screens tool groups hidden screens into a dropdown menu, making navigation smoother. Buttons can be added to link to other screens or external URLs, improving user interaction within the app.
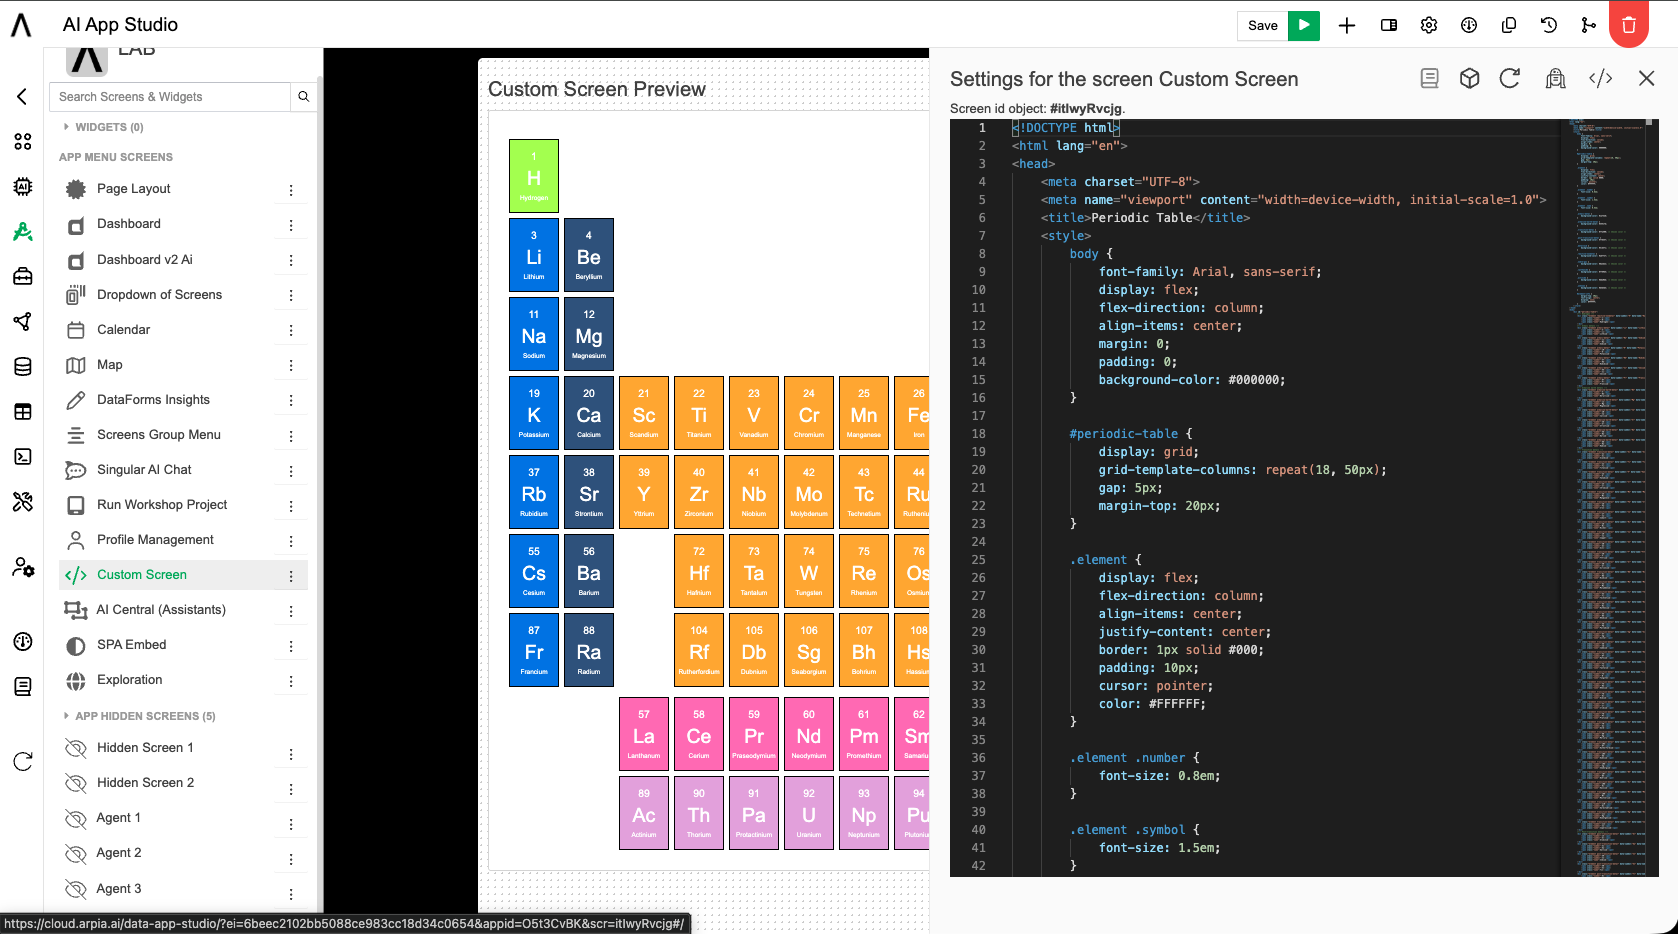
Custom Screen
The Custom Screen gives users complete control over the design of a screen. Users can utilize HTML tags for content structure and CSS properties for styling, offering endless customization possibilities.
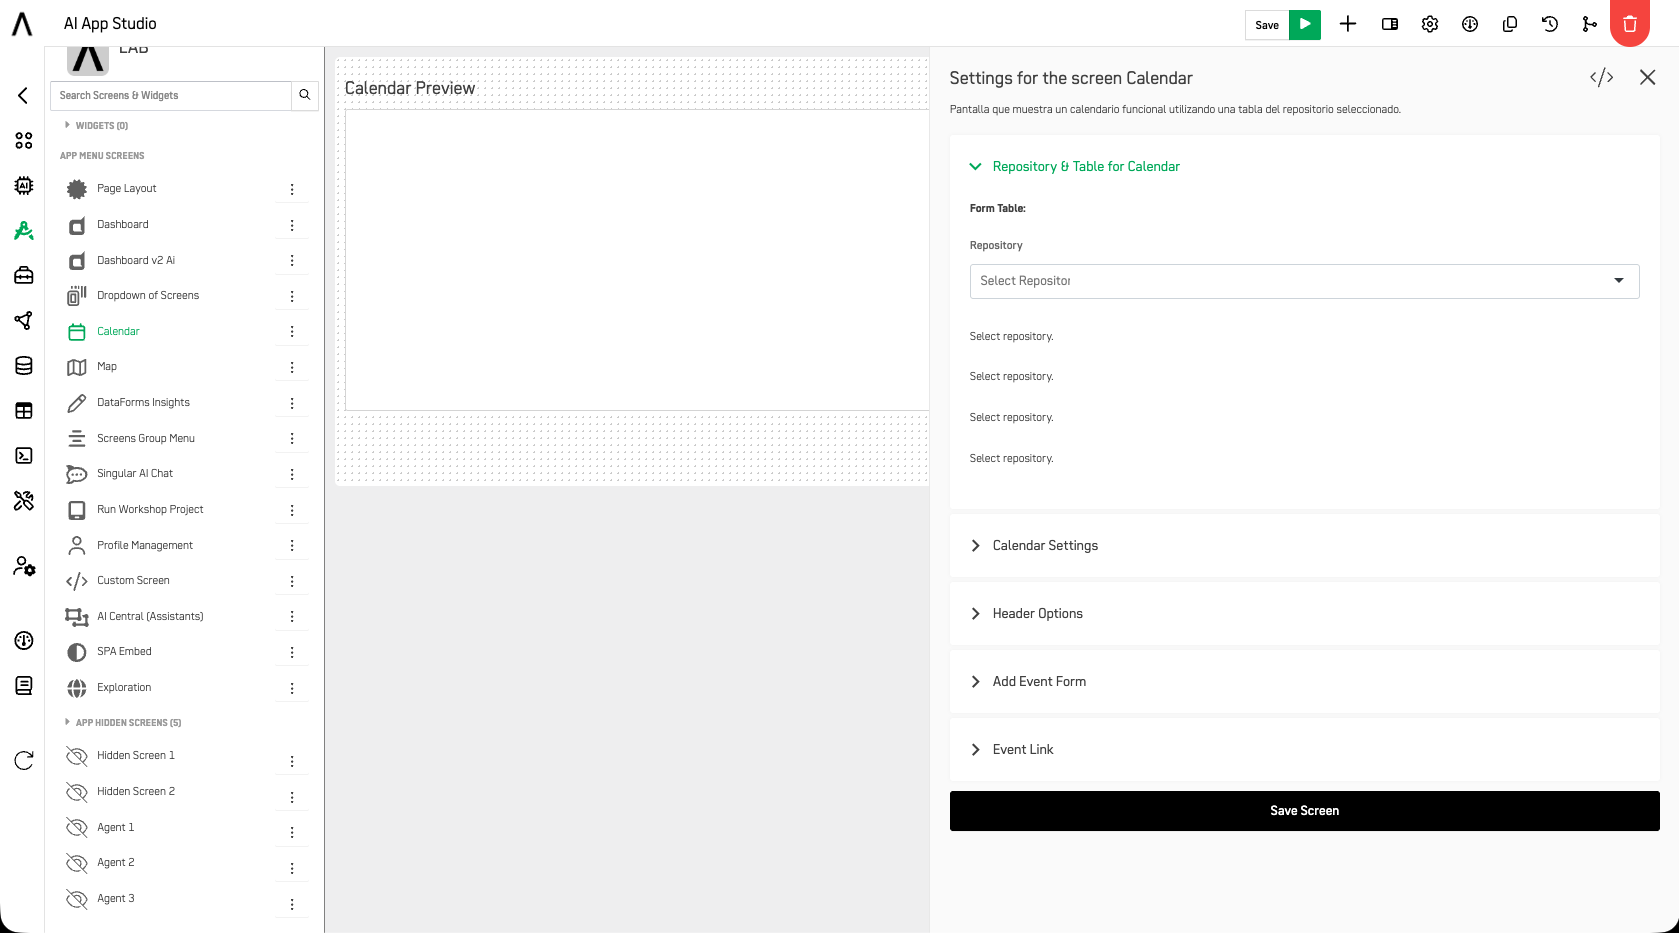
Calendar
The Calendar screen lets users create customized calendars by selecting data from a repository and configuring events. It offers full control over calendar management, visualizing data based on time and events.
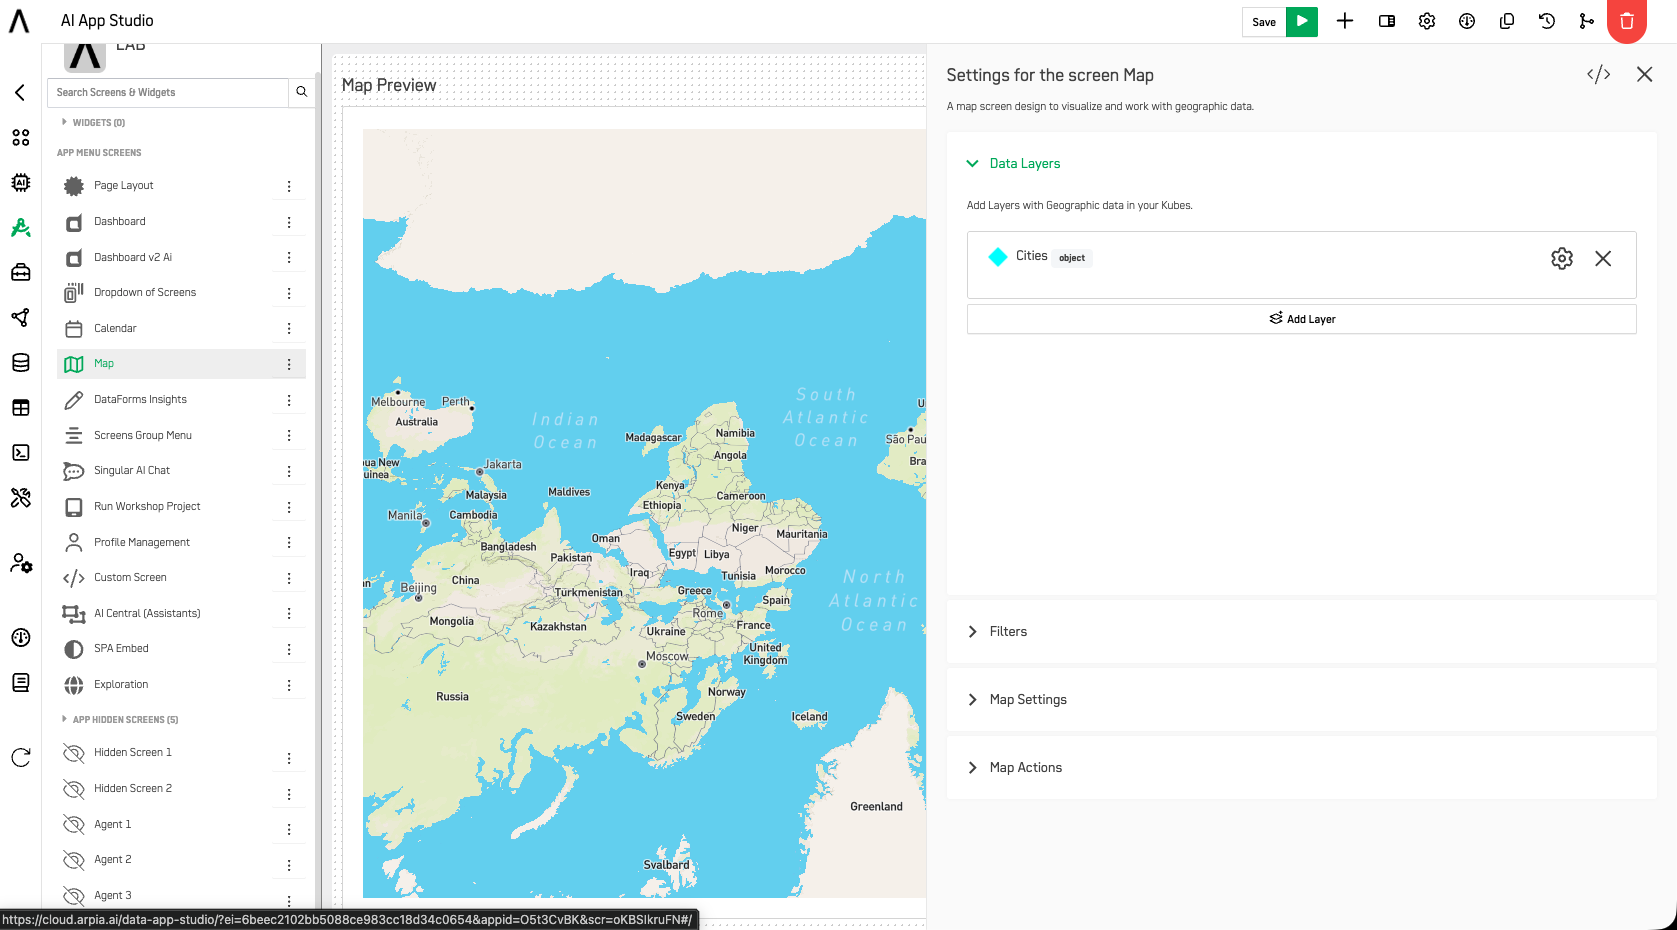
Map
The Map screen is designed for geographic data visualization. Users can add data layers, apply filters, and customize the presentation of the map for more effective geospatial data analysis.
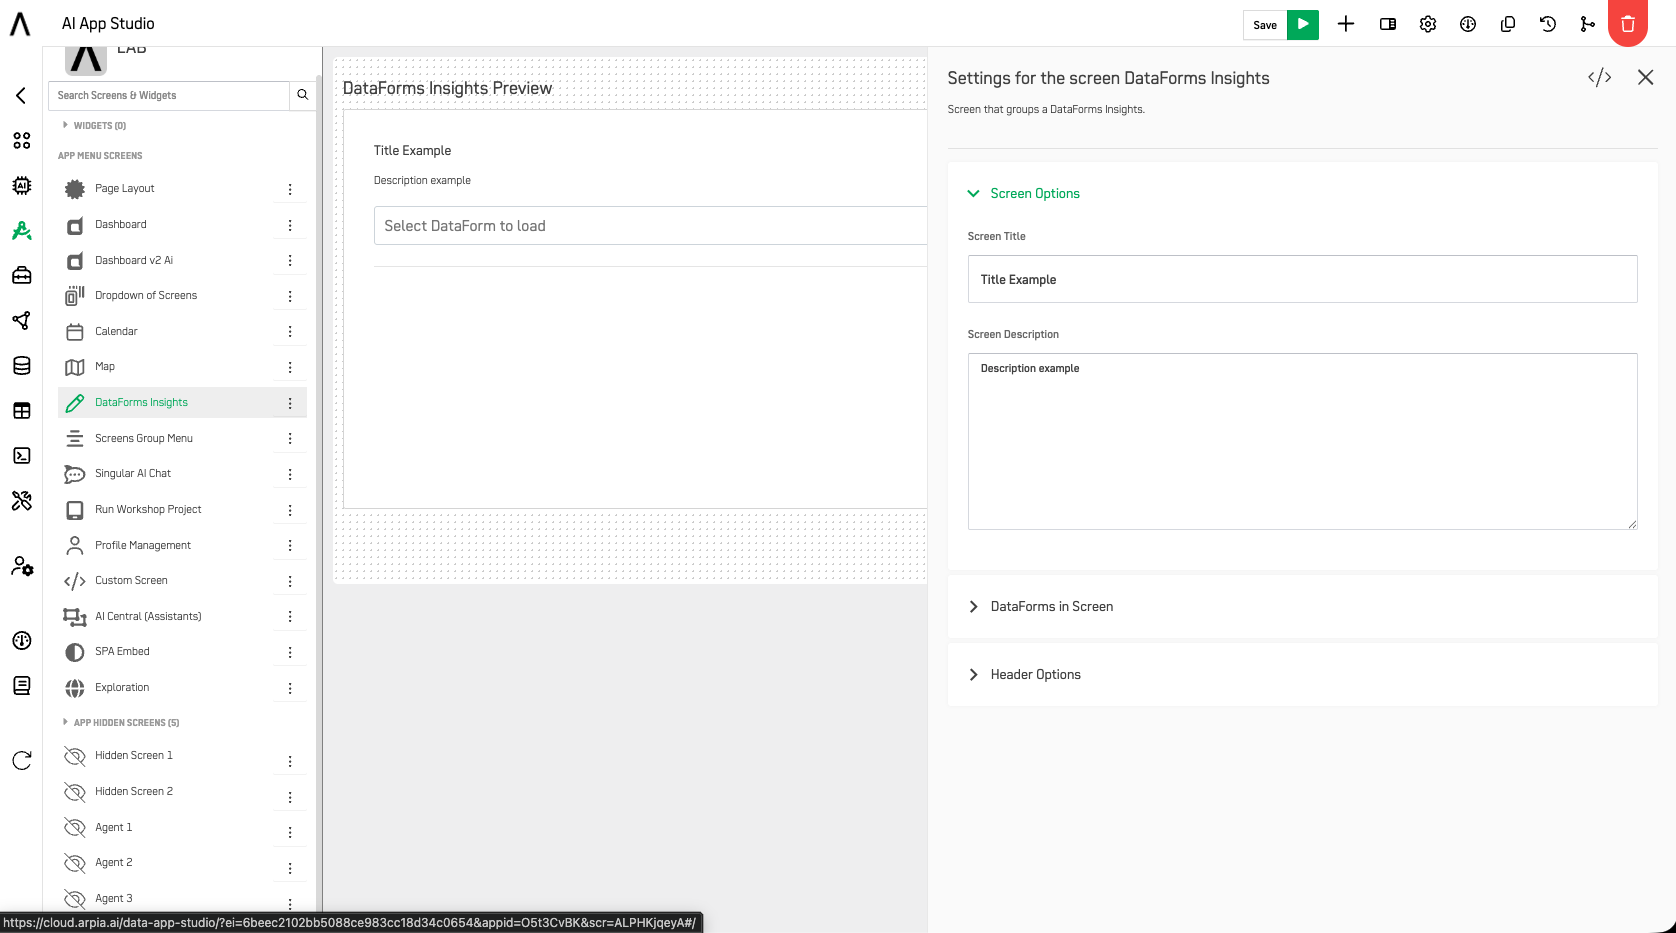
DataForms Insights
The DataForms Insights screen organizes perspectives of DataForms, enabling users to visualize responses and manage data collection processes more effectively.
Screens Group Menu
The Screens Group Menu screen groups hidden screens into a single DataApp menu item, supporting Sub Menu or Nav Bar Item display types with an optional rotation timer for cycling through screens automatically.
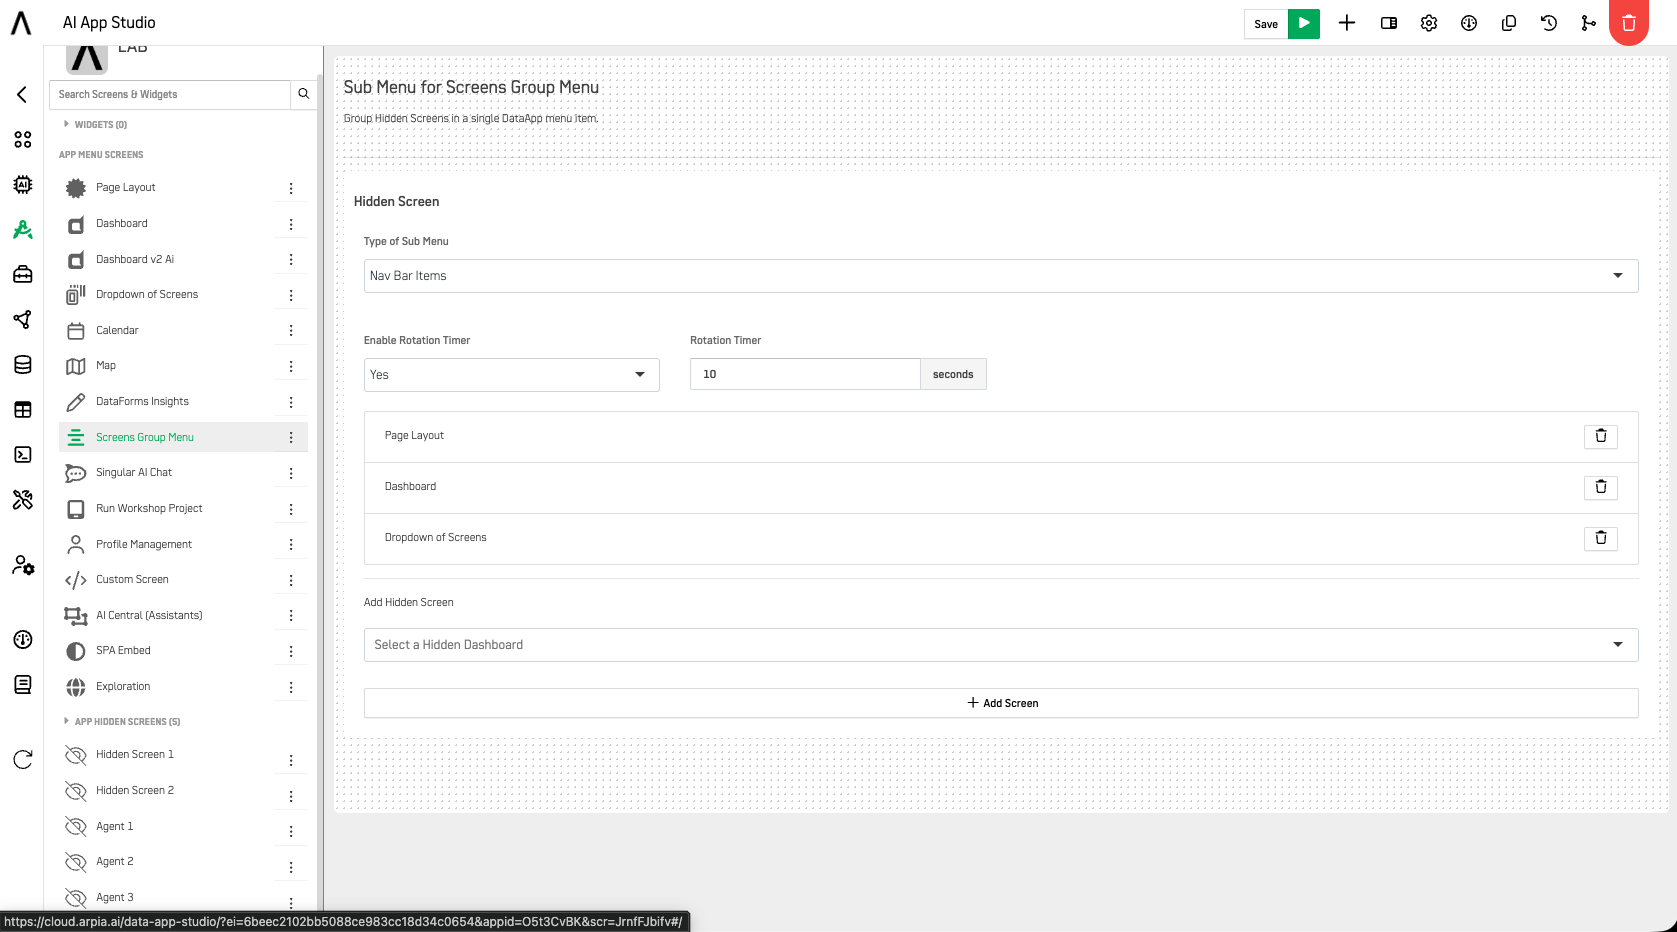
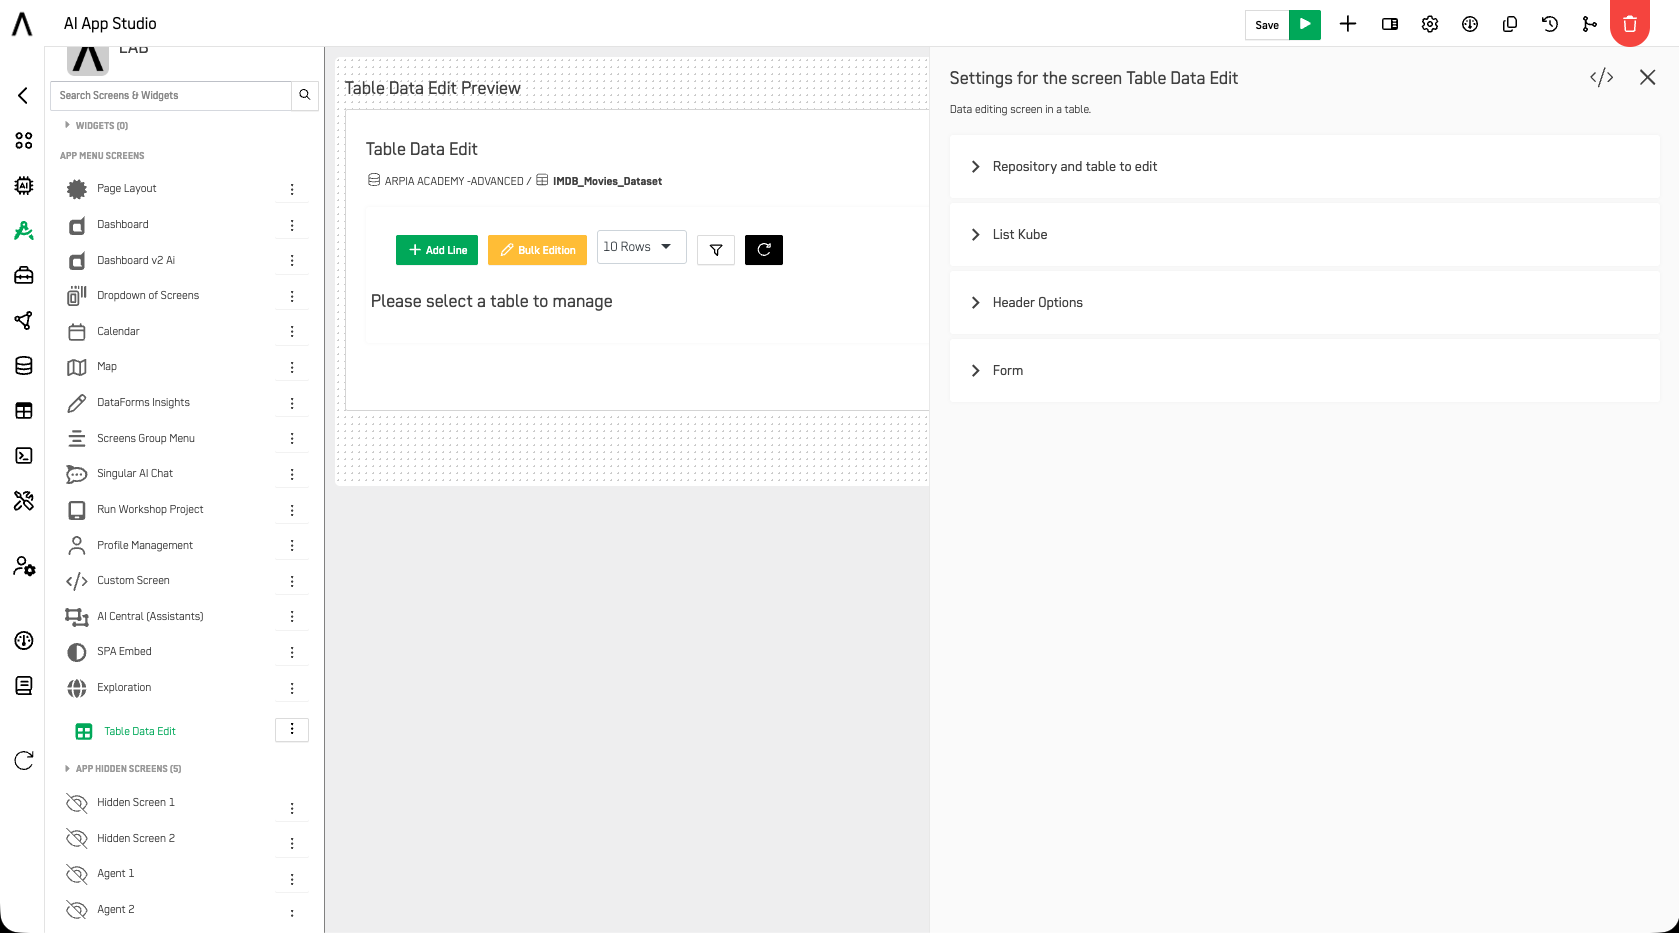
Table Data Edit
The Table Data Edit screen provides a dynamic interface for managing tabular data. Users can view, filter, and edit data directly within the app, offering efficient control over datasets.
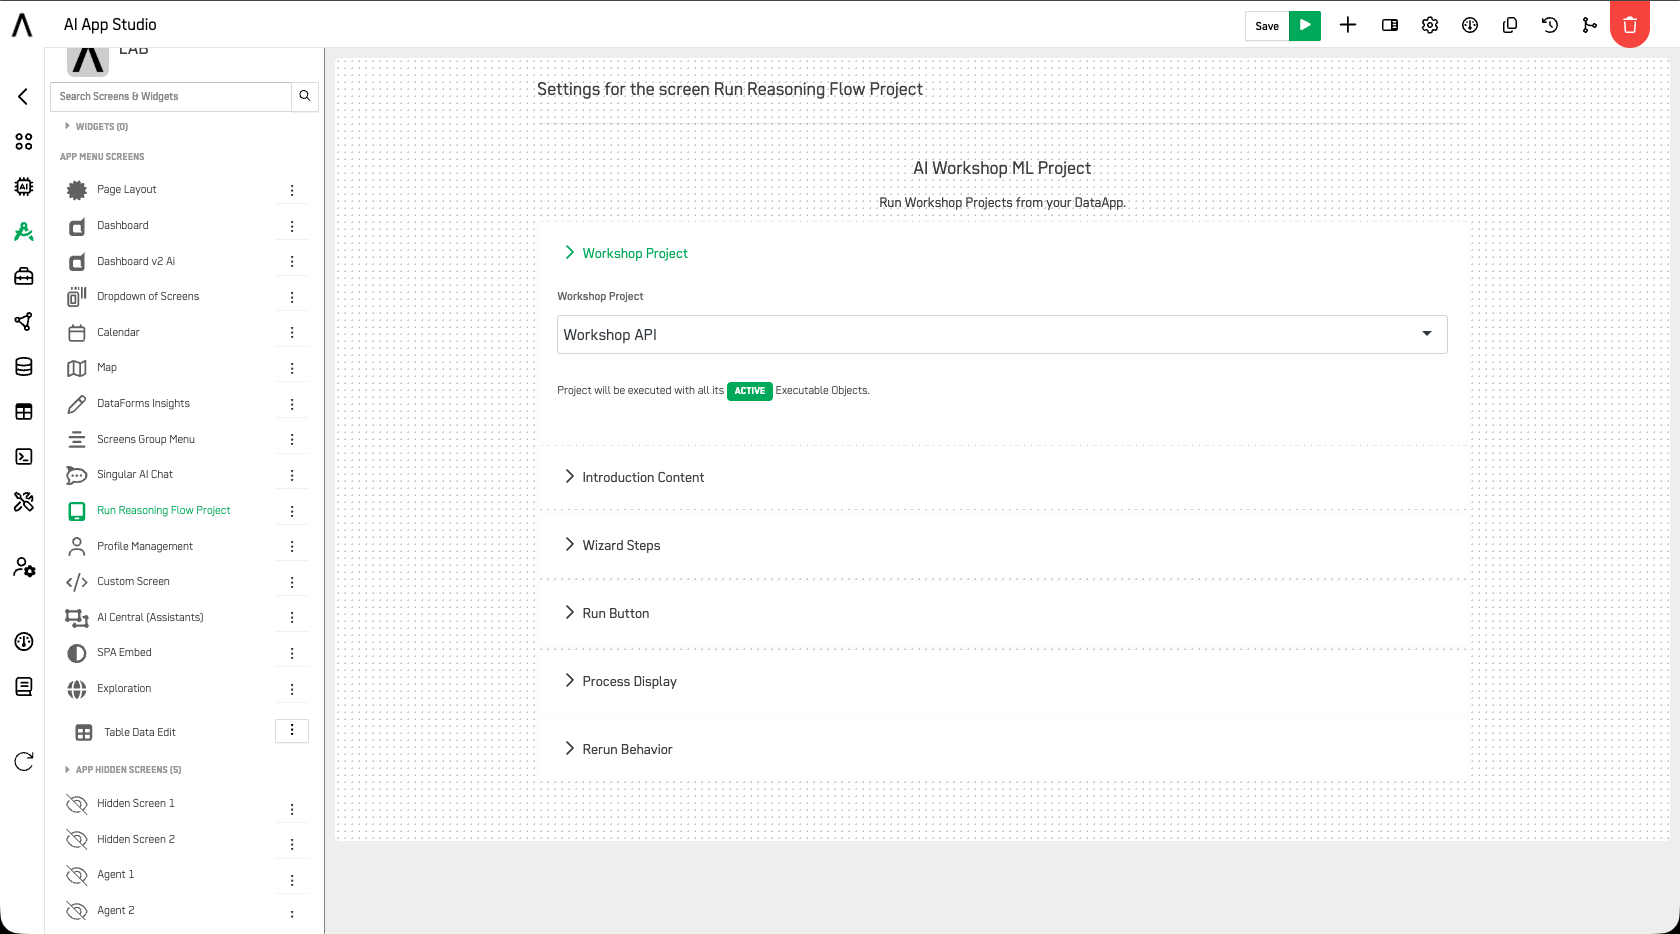
Run Reasoning Flow
The Run Reasoning Flow screen lets users run Reasoning Flows directly from a screen, displaying the flow objects that are in an active state for easy execution.
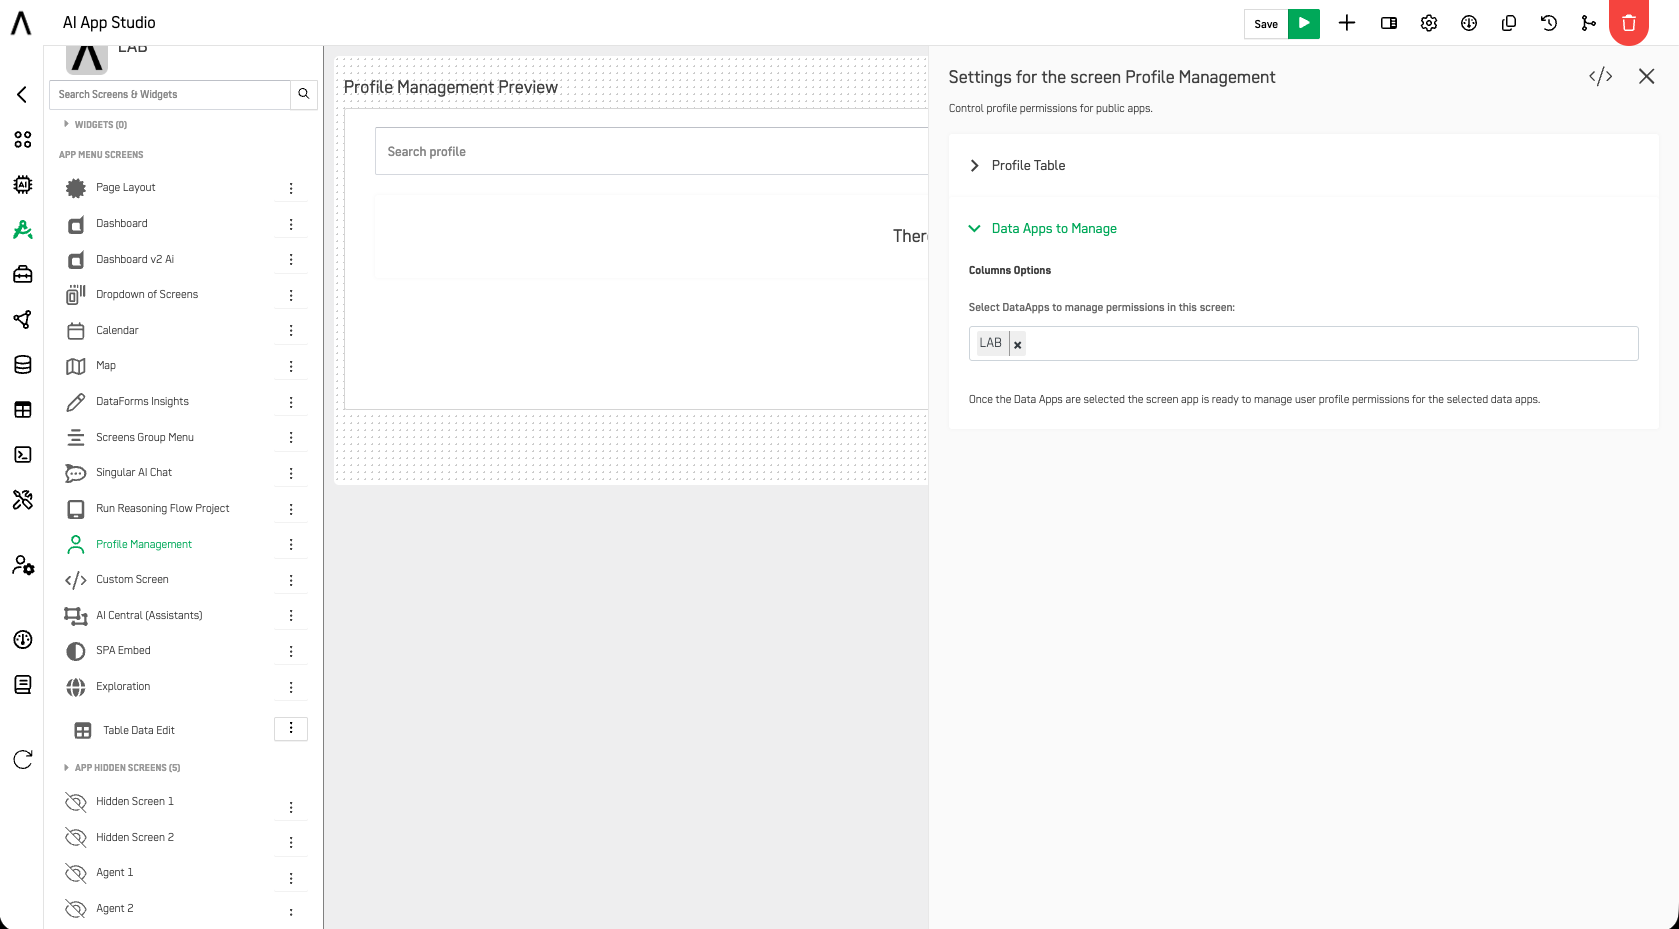
Profile Management
The Profile Management screen enables users to manage profiles in the DataApp, assigning specific permissions for each profile to control which screens they can access and use.
This overview of screens in DataApps provides insight into how various screens and their functionalities help improve user interaction, data visualization, and overall efficiency.
Updated 24 days ago