
Reasoning Atlas
Reasoning Atlas Overview
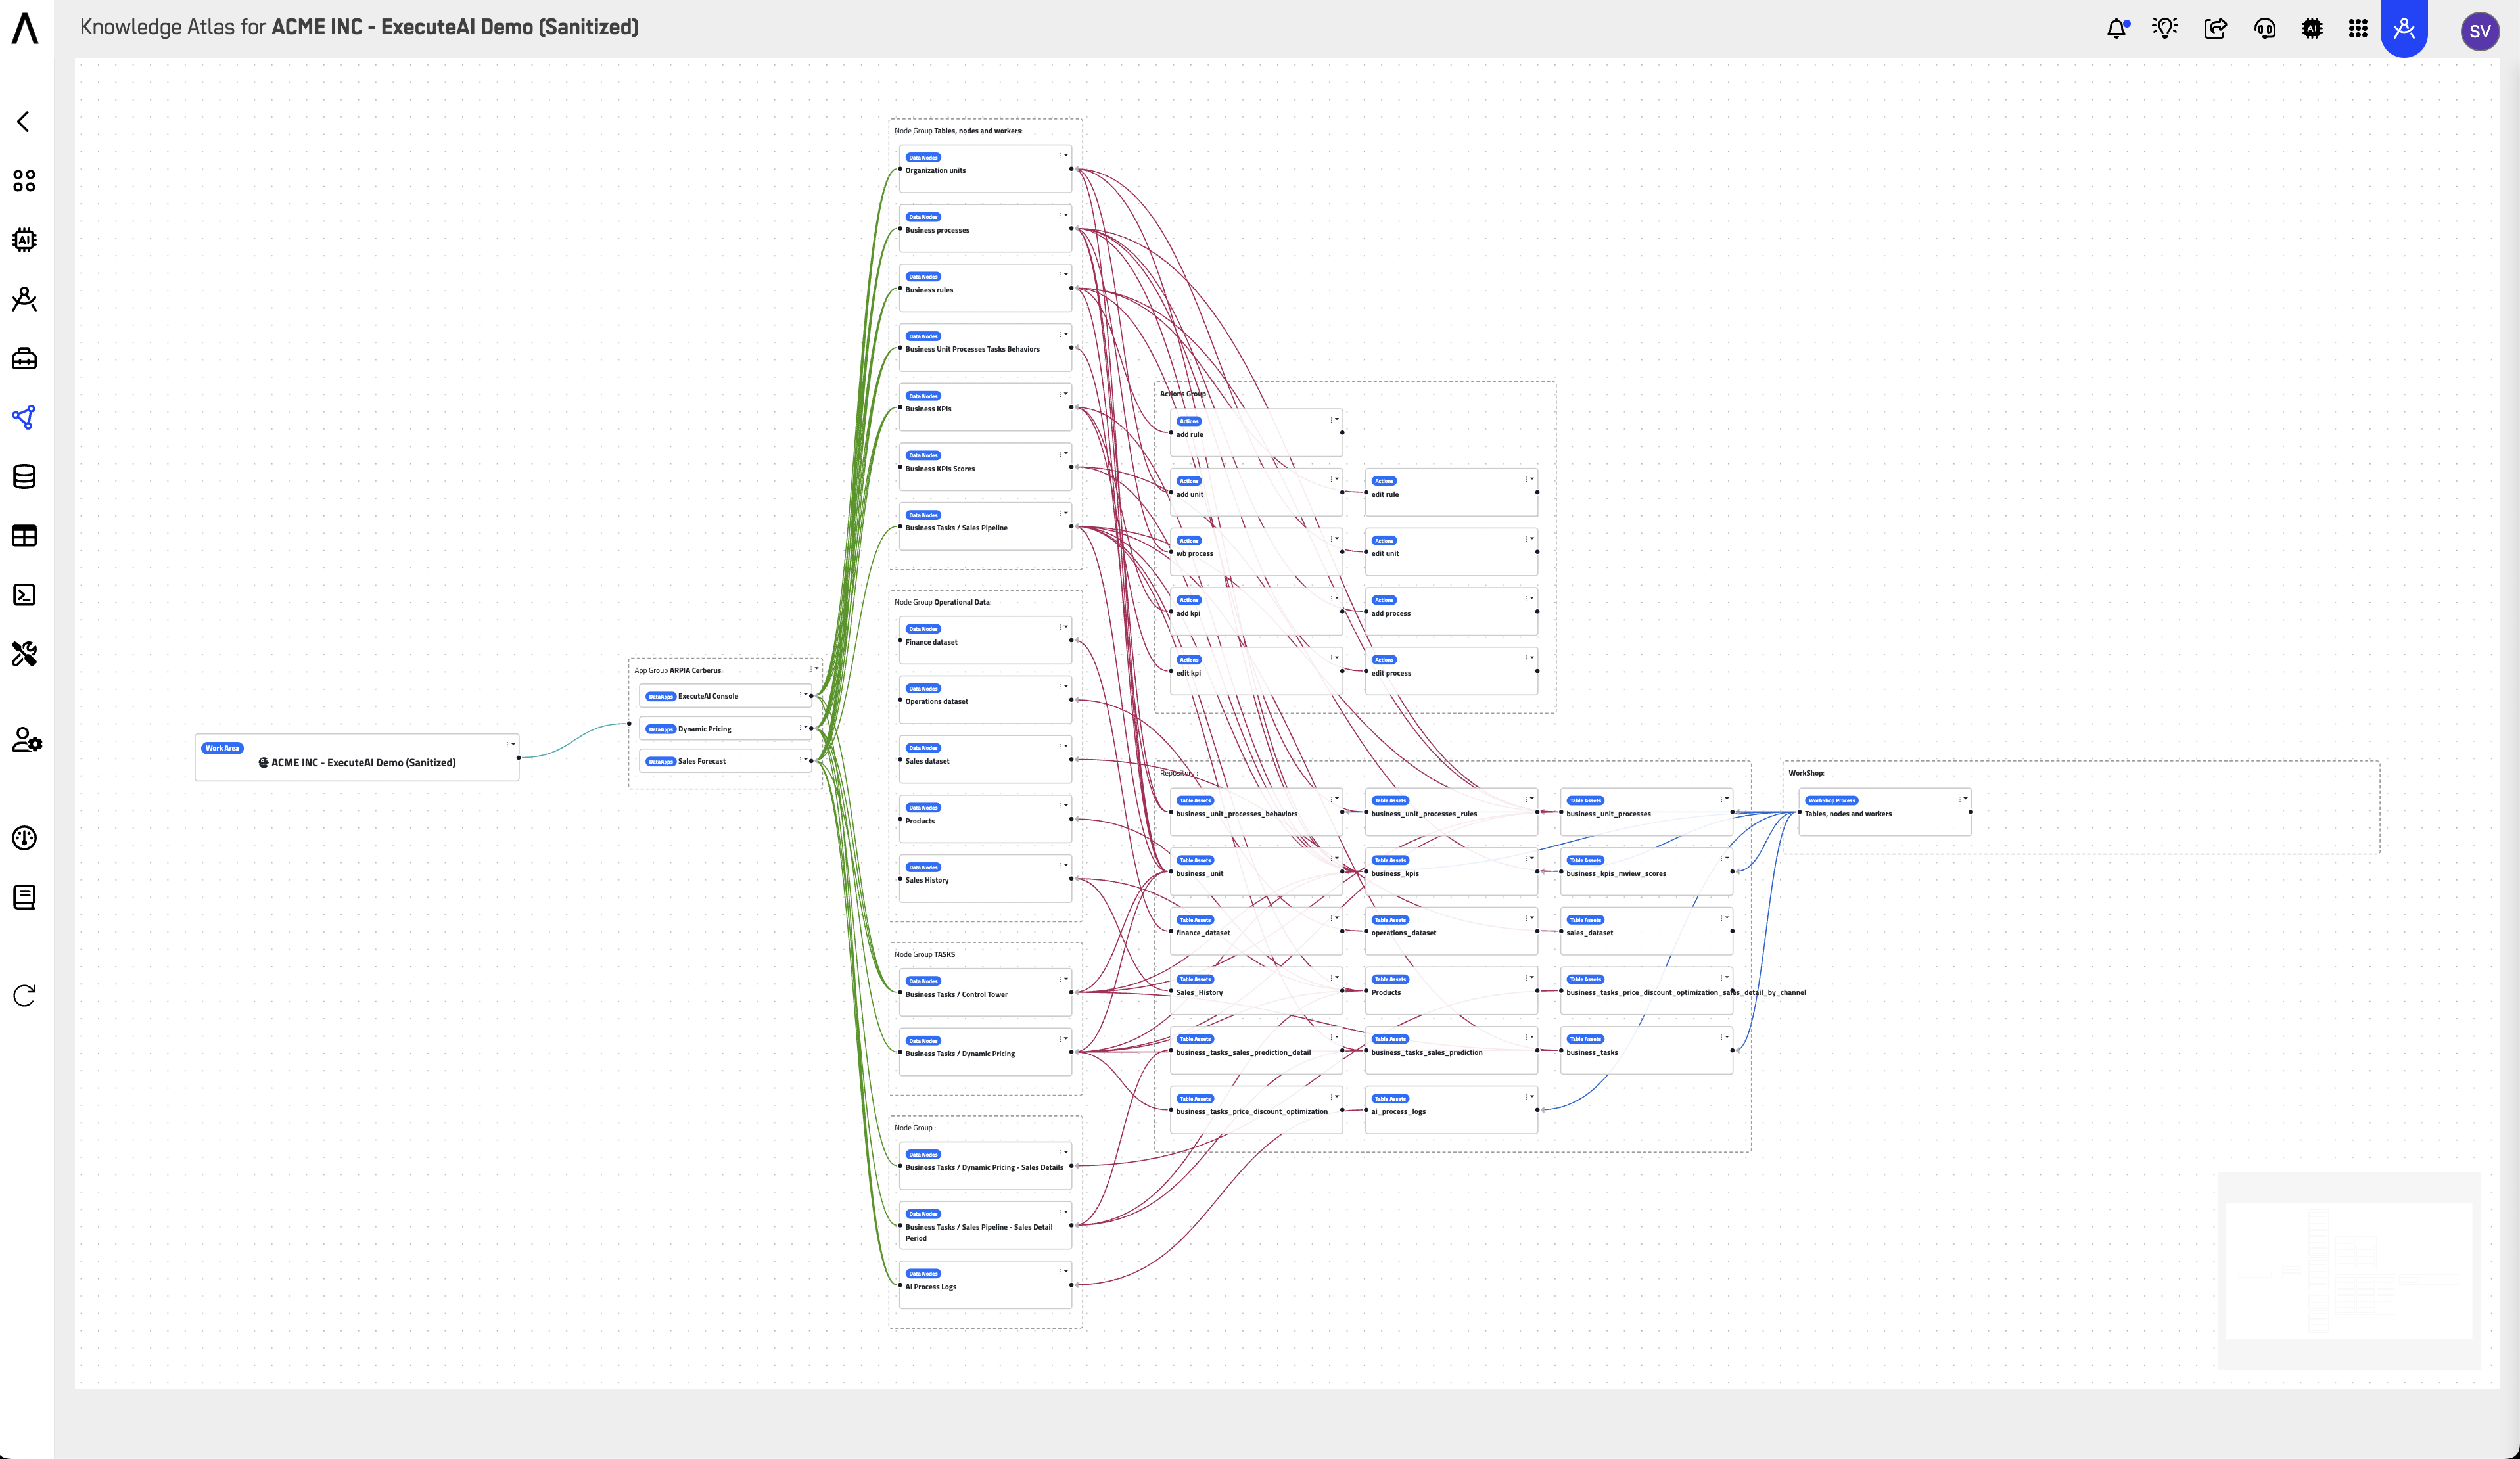
The visual mapping tool that shows how objects, data, and processes connect across your Reasoning Flows.
Purpose
The Reasoning Atlas is a visual and semantic map within Reasoning Flows that displays how all your objects — data pipelines, transformations, AI workflows, and more — are interconnected. It provides a complete picture of data lineage, dependencies, and process flows.
Unlike working directly in Reasoning Flows where you create and manage individual objects, the Reasoning Atlas gives you a bird's-eye view of your entire data ecosystem, making it easy to understand how data moves through your organization.
Atlas vs. Aerie: The Atlas shows how your reasoning is wired — structure, lineage, and dependencies. To watch objects run in real time, use Aerie, the live agent-operations workboard.
Where to Find It
Reasoning Atlas is accessed from the main navigation:
Reasoning Flows
├── Reasoning Flows  → Create and manage objects
├── Aerie            → Watch objects and agents run in real time
└── Reasoning Atlas  → View visual map of all objects
Interface Overview
Filters
Filter by Object Type
Narrow the view to specific types of objects: Apps, Repository Tables, Knowledge Nodes, WorkShop Nodes, ETL Nodes, AutoAPI, MCP Tools, and Actions.
Filter by Language
Filter objects by implementation language or flow type: PHP, Python, JS, and AI Flow.
View Options
View Linear Flow of Selected Node
With a node selected, toggle this option to display that node's flow as a linear sequence — its upstream sources and downstream consumers laid out in order, instead of the full network graph.
Show Connected Only
Toggle between showing all objects and showing only connected ones. When active, disconnected (orphaned) objects are hidden and the toolbar reports how many are filtered out — a quick way to declutter the graph, or, inverted, a quick way to find orphaned objects.
Node and Link Counters
The toolbar displays a live count of nodes and links currently in view, which updates as filters are applied.
Search
Click the magnifier icon at the right of the toolbar to expand the search field and find specific objects by name.
Navigation Controls
- Zoom In/Out (+/-) — Adjust the view scale
- Fit — Auto-fit all objects in the viewport
- Lock — Lock the current view position
Visual Elements
The Atlas displays objects as color-coded nodes connected by flow lines:
| Color | Meaning |
|---|---|
| 🟢 Green | Active/healthy objects |
| 🟠 Orange | Objects requiring attention |
| 🔵 Blue | Data sources or inputs |
| ⬜ White/Gray | Supporting or inactive objects |
Flow lines show the direction of data movement, typically from left (sources) to right (outputs/consumers).
Key Benefits
End-to-End Visibility
See how data sources, AI models, and business processes connect across the entire platform.
Data Lineage & Governance
Track the journey of data from source to outcome, ensuring traceability and compliance.
Cross-Team Alignment
Provides a shared reference point for business, engineering, and data science teams.
Impact Analysis
Before modifying an object, see what downstream processes depend on it.
Debugging & Troubleshooting
Quickly identify broken connections or failed processes in the visual flow. For live execution status and error traces, pair the Atlas with Aerie.
Common Use Cases
Understanding Data Flow
New team members can quickly understand how data moves through the system by exploring the Atlas.
Impact Assessment
Before changing a data pipeline, check the Atlas to see which downstream objects depend on it.
Documentation
Use the Atlas view as living documentation of your data architecture.
Auditing & Compliance
Demonstrate data lineage and governance to auditors by showing the complete flow from source to output.
Optimization
Identify redundant processes or opportunities to consolidate workflows.
Incident Investigation
When Aerie surfaces a failing object, open the Atlas to see its upstream sources and downstream dependents — the structural context for assessing blast radius.
Who Uses the Reasoning Atlas
The Atlas serves everyone who needs to understand structure before acting, with each role using it differently:
| Role | Primary use | What they're looking for |
|---|---|---|
| Data / platform engineers | Impact analysis | Downstream dependencies before modifying or retiring an object |
| New team members | Onboarding | A current, visual understanding of how the workarea fits together |
| Architects / tech leads | Architecture hygiene | Redundant pipelines, orphaned objects, and drift from the intended design |
| Compliance / audit functions | Lineage evidence | Traceable data journeys from source to output, ready to show without preparation |
| Business stakeholders | Presentations (linear view) | A simple source → transform → outcome narrative of how results are produced |
Note: The Atlas shows structure — how objects are wired. For live execution state, pair it with Aerie: Aerie identifies what failed; the Atlas shows who downstream will feel it.
Best Practices
Organize objects logically. Use clear naming conventions so the Atlas is easy to navigate.
Use Project Categories consistently. Proper categorization makes filtering more effective.
Review the Atlas regularly. Check for orphaned objects or broken connections — the Show Connected Only toggle reports exactly how many disconnected objects exist, making this sweep a one-click check.
Document object purposes. Add descriptions to objects so their role is clear in the Atlas view.
Use linear flow for presentations. Select the node your story centers on and use the linear view — a single source → transform → outcome sequence is easier to explain to stakeholders than the full graph.
Related Documentation
-
Reasoning Flows Overview
Learn how to create and manage the objects that appear in the Atlas. -
Monitoring with Aerie
Watch your Reasoning Flows and their objects run in real time on the live agent-operations workboard. -
ARPIA Data Layer Framework
Understand the RAW → CLEAN → GOLD → OPTIMIZED data progression. -
Data Models (Nodes)
Create semantic definitions for your data objects. -
AI Apps Overview
Orchestrate multiple objects into complete applications.
Updated about 1 month ago