
Filters
🔍 Filters Overview
Filters are an essential feature in the Insights section, allowing users to organize and refine data across different visualization options outlined in the Insights article.
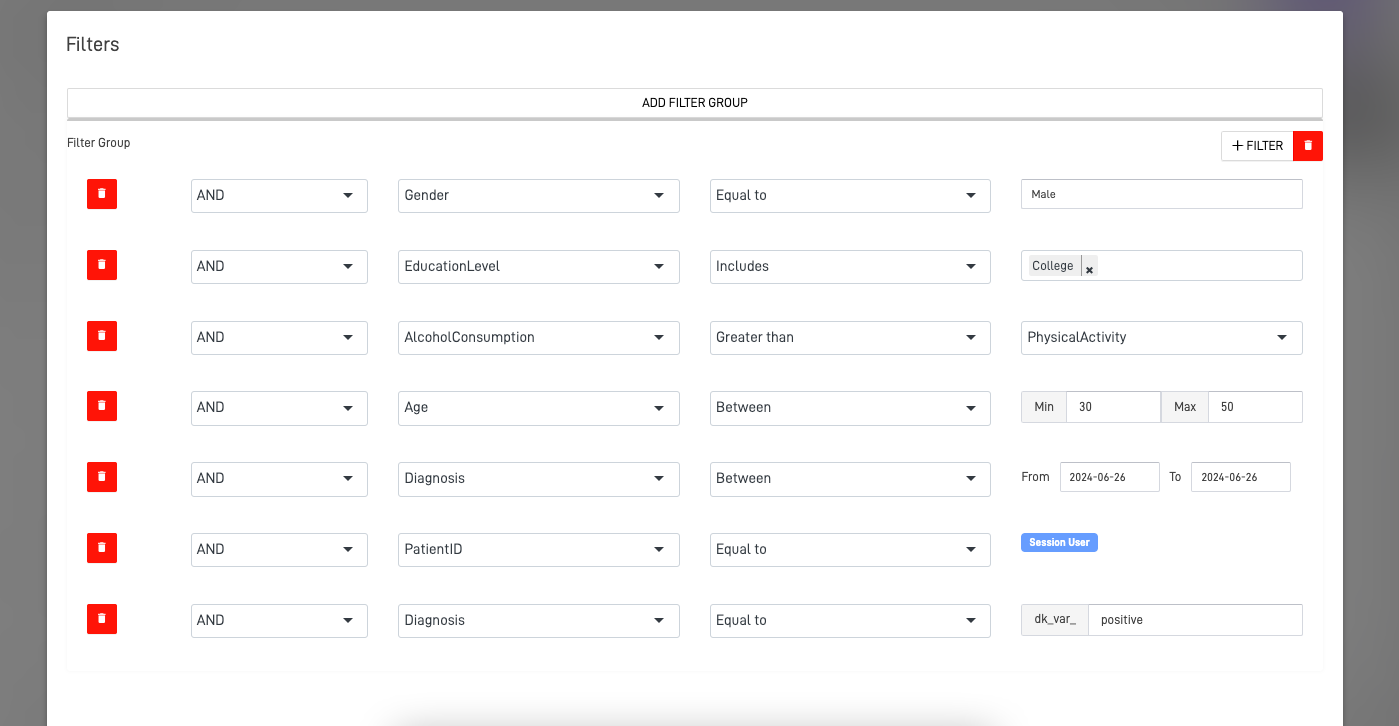
🛠️ Types of Filters
Filters come in several types, each designed for specific data comparisons:
| Filter Type | Description |
|---|---|
| Normal | Comparison filters with a specific value. |
| Multiple Values | Compares a list of values (similar to IN and NOT IN in SQL). |
| Field to Field | Applies a filter on a field by comparing it to another field in the same KnowGraph. |
| Numeric Range | Filters data by checking whether the selected numeric field falls within a specified range. |
| Date Range | Filters data based on a date field within a given date range. |
| Logged-In ARPIA User | Filters data by comparing a KnowGraph field to the currently logged-in ARPIA user. |
| Global Variable from DataApp | Compares a field with a global variable previously configured in a DataApp screen. |
🧪 Examples by Filter Type
The examples below use a fictional sales_orders KnowGraph with the following representative fields: order_id, customer_name, region, status, total_amount, discount_amount, order_date, sales_rep_email.
🔹 Normal Filter
Use case: Show only completed sales orders.
Business scenario: The Sales Director wants a dashboard widget that displays only the orders that have been finalized, ignoring drafts, pending approvals, or cancelled orders.
| Setting | Value |
|---|---|
| Field | status |
| Operator | Equal to (=) |
| Value | Completed |
SQL equivalent:
WHERE status = 'Completed'
Other operators available:
!=,>,<,LIKE,IS NULL.
🔹 Multiple Values Filter
Use case: Show orders only from selected priority regions.
Business scenario: The Regional Manager oversees three priority markets and wants the dashboard to display only orders from those regions, excluding all other geographies.
| Setting | Value |
|---|---|
| Field | region |
| Operator | IN |
| Values | North America, LATAM, EMEA |
SQL equivalent:
WHERE region IN ('North America', 'LATAM', 'EMEA')
NOT IN variation: Use the same setup with the
NOT INoperator to exclude those regions instead — useful for reports such as "all markets except our priority regions".
🔹 Field to Field Filter
Use case: Identify orders where the discount amount is greater than or equal to the total amount (data integrity check).
Business scenario: The Finance team suspects some sales reps are entering discounts incorrectly, resulting in orders with discounts equal to or larger than the order total. The dashboard should surface these anomalies automatically.
| Setting | Value |
|---|---|
| Field A | discount_amount |
| Operator | >= |
| Field B | total_amount |
SQL equivalent:
WHERE discount_amount >= total_amount
Why it matters: Field to Field filters compare two columns from the same KnowGraph row. They are powerful for validation, ratio analysis, or any condition where the threshold is dynamic per record.
🔹 Numeric Range Filter
Use case: Show only mid-tier orders (between $1,000 and $10,000).
Business scenario: The Marketing team is segmenting customers by purchase size to design a targeted email campaign for mid-tier buyers — large enough to be valuable, but not in the enterprise tier handled by direct account managers.
| Setting | Value |
|---|---|
| Field | total_amount |
| Minimum | 1000 |
| Maximum | 10000 |
SQL equivalent:
WHERE total_amount BETWEEN 1000 AND 10000
Tip: Numeric ranges are inclusive on both ends. Combine them with other filters for tier-based reporting (small / mid / enterprise).
🔹 Date Range Filter
Use case: Show orders placed during the second quarter of 2026.
Business scenario: The CFO requests a Q2 performance report. The dashboard should automatically filter all visualizations to show only data within that quarter.
| Setting | Value |
|---|---|
| Field | order_date |
| Start date | 2026-04-01 |
| End date | 2026-06-30 |
SQL equivalent:
WHERE order_date BETWEEN '2026-04-01' AND '2026-06-30'
Dynamic options: ARPIA also supports relative date ranges such as Last 7 days, Last 30 days, Year to date, and Current month — ideal for live dashboards that should always reflect the most recent activity.
🔹 Logged-In ARPIA User Filter
Use case: Show each sales representative only the orders assigned to them.
Business scenario: A single dashboard is shared with the entire sales team, but each rep should only see their own performance. Instead of building one dashboard per user, a Logged-In User filter personalizes the view automatically.
| Setting | Value |
|---|---|
| Field | sales_rep_email |
| Operator | = |
| Value | {logged_in_user.email} |
SQL equivalent (conceptual):
WHERE sales_rep_email = CURRENT_USER_EMAIL()
Best practice: Use this filter for row-level security scenarios — sales pipelines, expense reports, ticket queues, performance metrics — where each user must only see records that belong to them.
🔹 Global Variable from DataApp Filter
Use case: A DataApp screen has a region selector at the top. All charts on the screen should react to the selected region.
Business scenario: The Operations team uses a single DataApp page with a dropdown labeled "Select Region". Whenever the user picks a different region, every visualization (sales chart, top customers table, KPI cards) updates immediately based on that selection.
| Setting | Value |
|---|---|
| DataApp variable | $selected_region |
| Field | region |
| Operator | = |
| Value source | {globalVar.selected_region} |
SQL equivalent (conceptual):
WHERE region = :selected_region
Why this is powerful: Global Variables turn static dashboards into interactive applications. One filter definition is reused across many widgets, and the user controls all of them through a single input on the DataApp screen.
📊 Side-by-Side Comparison
| Filter Type | Example Field | Example Condition | Best For |
|---|---|---|---|
| Normal | status | = 'Completed' | Single static value comparison |
| Multiple Values | region | IN ('NA', 'LATAM', 'EMEA') | Whitelisting / blacklisting |
| Field to Field | discount_amount vs total_amount | >= | Validation, ratio comparisons |
| Numeric Range | total_amount | BETWEEN 1000 AND 10000 | Tiering, segmentation |
| Date Range | order_date | BETWEEN '2026-04-01' AND '2026-06-30' | Period-based reporting |
| Logged-In User | sales_rep_email | = CURRENT_USER | Row-level security |
| Global Variable | region | = $selected_region | Interactive DataApps |
💡 Key Takeaways
- Normal and Multiple Values filters are ideal for comparing static values.
- Field to Field filters allow more dynamic comparisons within KnowGraphs.
- Range filters (numeric and date) help refine data by specific ranges.
- User-specific filters personalize data for the currently logged-in user.
- Global Variables allow filters to pull data from application-defined variables, enhancing flexibility in DataApps.
Updated 3 months ago