
Data Governance - Usage Statistics
Data governance platforms often track how frequently and by whom data is accessed. This includes information on the most queried tables, the type of queries run (e.g., read, write, update, delete), and the performance of these queries (such as execution times).
Usage statistics in the context of a Data Governance Platform provide critical insights into how data within an organization is accessed and utilized. These metrics are fundamental for optimizing data management strategies, ensuring efficient use of resources, and improving overall data access patterns.
What are Usage Statistics?
Usage statistics refer to the collection, measurement, and analysis of data pertaining to the access and use of information stored in databases, data lakes, or any other data repositories. This information typically includes details about which tables and databases are accessed, the frequency of access, the types of operations performed (e.g., read, write, update, delete), and the users or applications making those accesses.
Importance of Usage Statistics
-
Resource Optimization: By monitoring which data is accessed most frequently, organizations can optimize their storage and computing resources. For instance, frequently accessed data can be moved to faster, more accessible storage solutions, whereas rarely used data can be archived in cheaper, slower storage.
-
Performance Tuning: Usage statistics help identify bottlenecks and performance issues in data access patterns. This allows database administrators to fine-tune indexes, queries, and database configurations to improve performance and reduce latency.
-
Capacity Planning: Understanding long-term trends in data access helps in anticipating future needs and planning for capacity upgrades. This ensures that the data infrastructure scales appropriately with the growing demands of the organization.
-
Security and Compliance: Tracking who accesses data and what operations they perform is critical for security audits and compliance reporting. It helps in detecting unauthorized access and ensuring that data usage complies with legal and regulatory standards.
-
User and Application Profiling: By analyzing usage patterns, organizations can identify which departments or applications rely most heavily on certain data sets. This aids in understanding the impact of data on business processes and prioritizing data governance initiatives accordingly.
-
Cost Management: In cloud-based environments, where data storage and access can incur significant costs, usage statistics are vital for managing expenses. They help in identifying costly operations and optimizing them to reduce overall expenditure.
Collecting Usage Statistics
The collection of usage statistics typically involves several components of the data infrastructure:
- Database Management Systems (DBMS) often provide built-in tools or logs that record access patterns and query performance.
- Data Access Layers in applications can also be instrumented to log details about data operations.
- Custom Monitoring Tools and integration with enterprise monitoring solutions can provide a more comprehensive view by aggregating data across multiple systems.
Analyzing and Reporting
Data gathered from monitoring usage must be analyzed to transform raw data into actionable insights. This often involves:
- Dashboards: Real-time monitoring of key metrics to provide an at-a-glance view of data usage.
- Alerting Systems: Automated alerts that notify administrators of unusual access patterns or potential security breaches.
- Reports: Detailed reports that summarize usage over time, helping in strategic planning and operational reviews.
By leveraging usage statistics effectively, organizations can not only ensure their data governance is proactive but also enhance the overall efficiency and security of their data management practices.
Usage Statistics at the Knowledge Nodes in AP
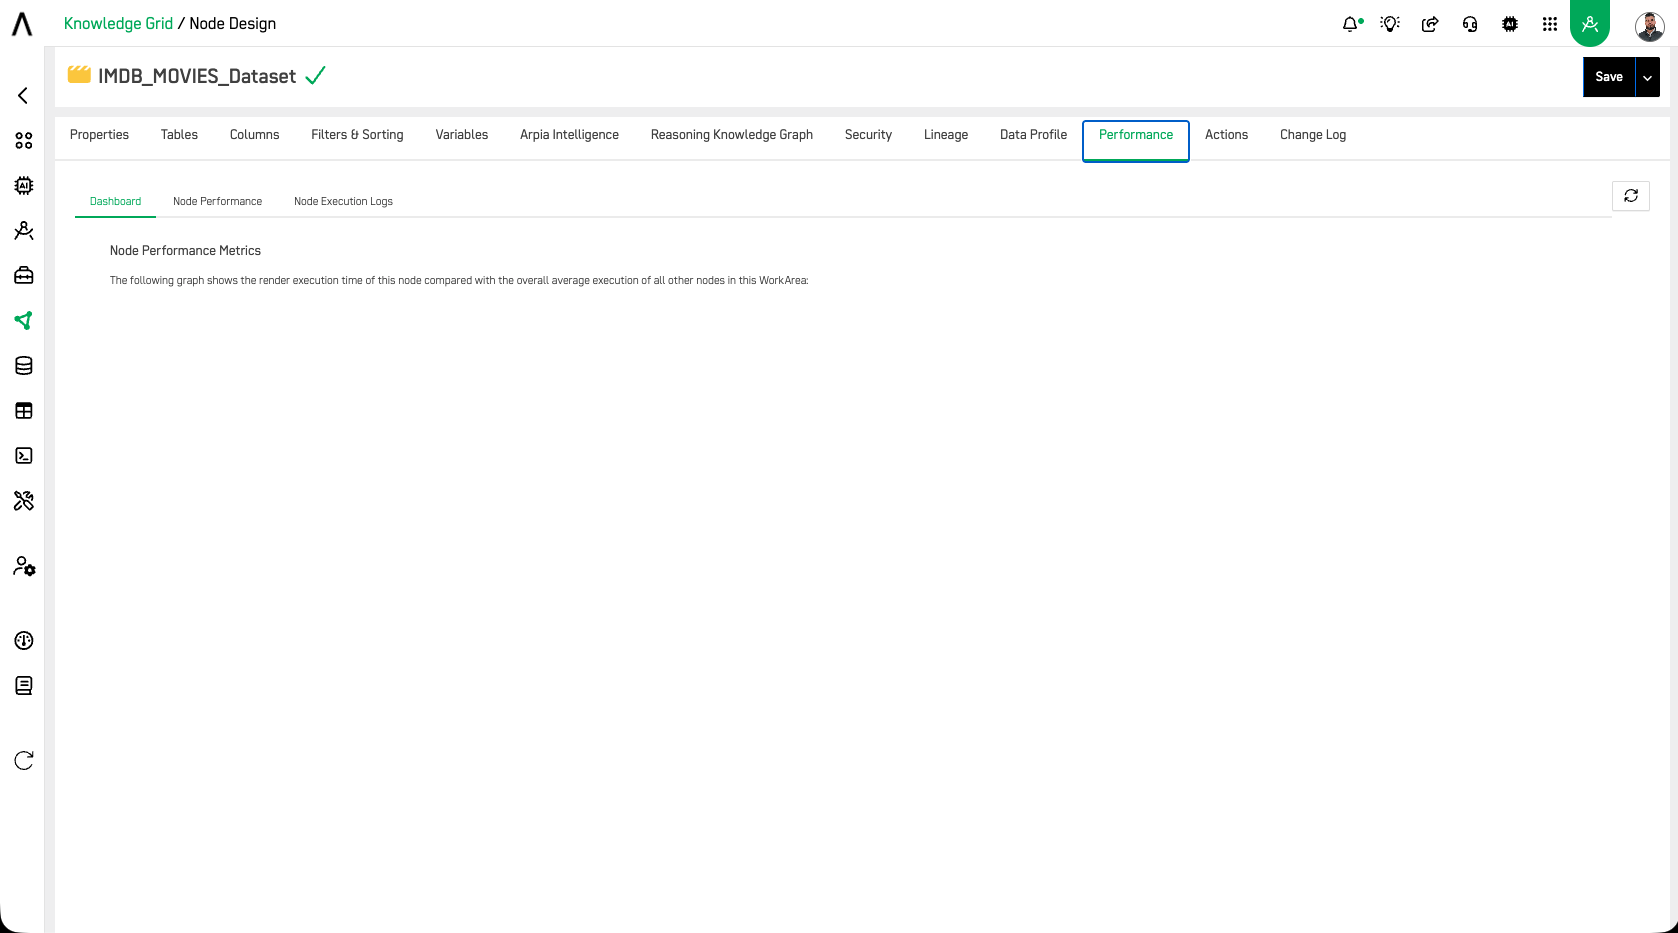
You may access usage on any Knowledge Node in AP inside the Node settings under the Performance tab. The Performance tab contains three sub-tabs:
Dashboard — Displays the Node Performance Metrics graph, showing the render execution time of this node compared to the overall average execution of all other nodes in the WorkArea.
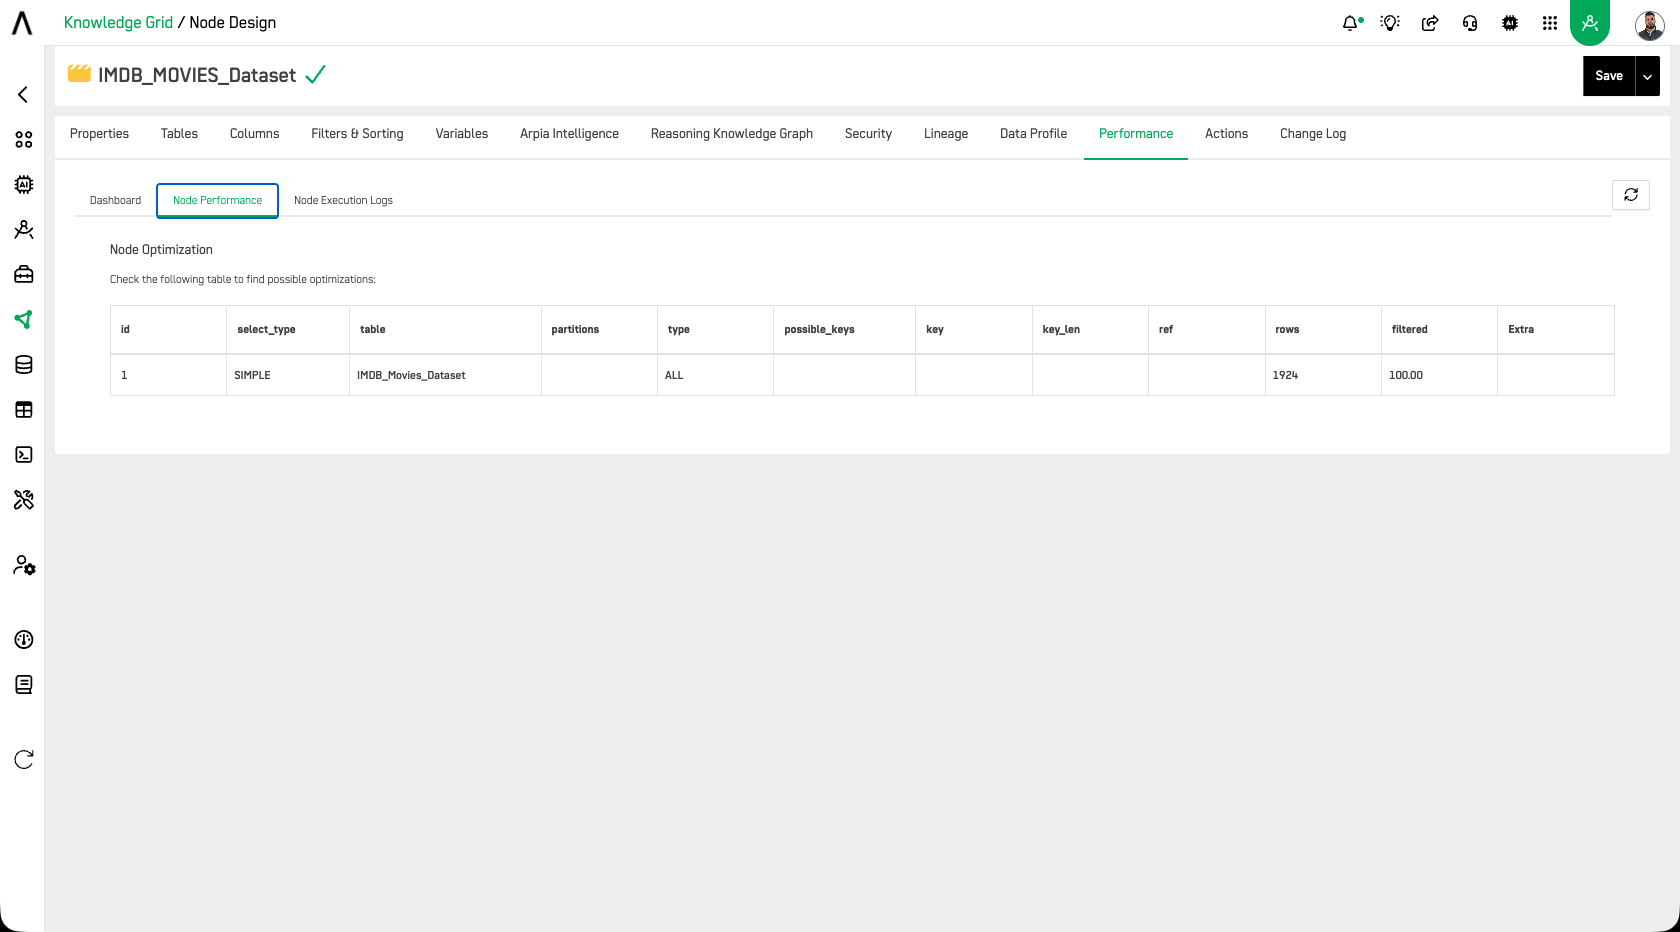
Node Performance — Displays the Node Optimization table, which runs a query explain plan against the node's underlying data. This helps identify potential optimizations such as missing indexes, full table scans, and query inefficiencies.
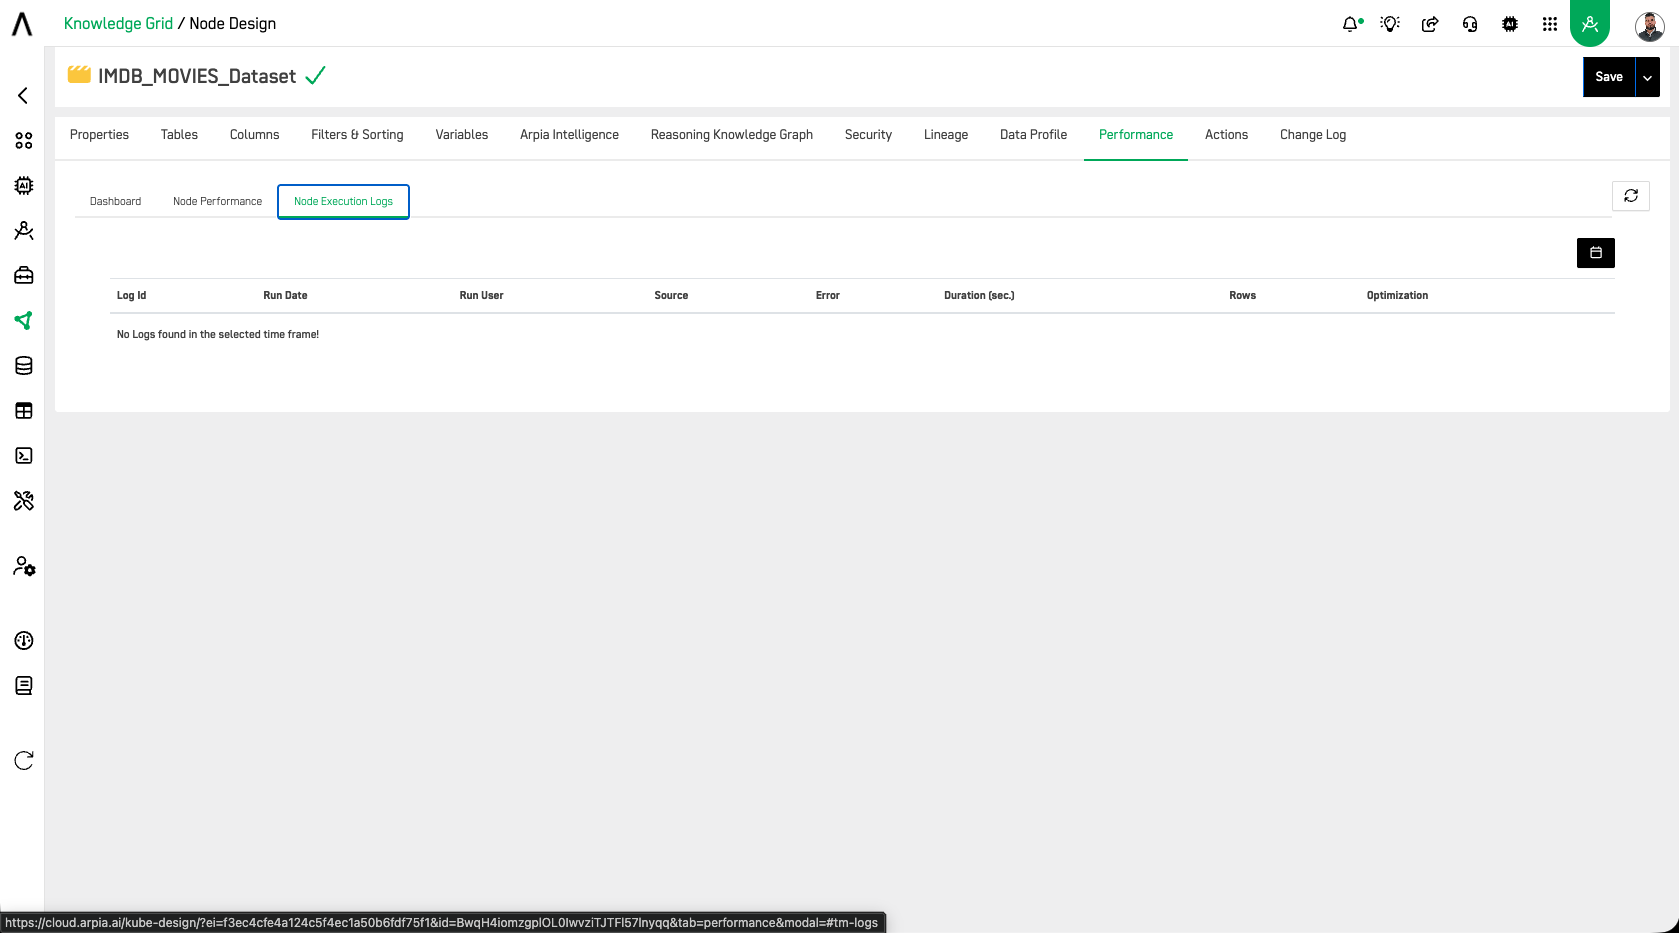
Node Execution Logs — Displays a detailed execution log with the following columns: Log Id, Run Date, Run User, Source, Error, Duration (sec.), Rows, and Optimization. Use the date filter to analyze execution history and identify performance bottlenecks or data delivery errors over time.
🏛️ Compliance Framework Alignment
Tracking and analyzing usage statistics directly supports the following compliance frameworks:
| Requirement | ISO 42001 | SOC 2 Type 2 | ISO 27001 | GDPR | HIPAA | NIST AI RMF | DORA |
|---|---|---|---|---|---|---|---|
| Access monitoring & audit logs | ✅ | ✅ | ✅ | ✅ | ✅ | ✅ | ✅ |
| Performance & availability tracking | ✅ | ✅ | ✅ | ||||
| User behavior & access profiling | ✅ | ✅ | ✅ | ✅ | ✅ | ✅ | |
| Capacity planning & resource management | ✅ | ✅ | ✅ | ||||
| Anomaly detection & incident response | ✅ | ✅ | ✅ | ✅ | ✅ | ✅ | |
| AI data pipeline monitoring | ✅ | ✅ |
Why Usage Statistics Support Each Framework
🤖 ISO 42001 — AI Management System
ISO 42001 requires organizations to monitor and evaluate the performance of AI systems and the data pipelines that feed them. ARPIA's Node Execution Logs and Performance Dashboard provide a continuous record of how data is being accessed, how long queries take, and whether errors are occurring — giving organizations the operational visibility needed to maintain AI system reliability and governance accountability.
🔐 SOC 2 Type 2 — Security, Availability, and Confidentiality
SOC 2 auditors evaluate whether systems are available and performing as expected over the audit period. ARPIA's Performance Dashboard and Node Execution Logs provide time-stamped evidence of node availability, execution times, and access patterns, directly supporting the Availability and Processing Integrity trust service criteria with verifiable operational records.
🛡️ ISO 27001 — Information Security Management
ISO 27001 requires organizations to monitor and log access to information assets and to review these logs regularly. ARPIA's execution logs — recording Run User, Source, Duration, Rows, and Error for every node execution — fulfill Annex A controls related to monitoring system use, protecting log information, and administrator and operator logs.
🇪🇺 GDPR — General Data Protection Regulation
GDPR requires organizations to demonstrate accountability over how personal data is accessed and processed. Usage statistics provide evidence of who accessed which Knowledge Node, when, and from what source — supporting Article 5's accountability principle and Article 30's Records of Processing Activities, as well as enabling organizations to detect and investigate potential unauthorized access to personal data.
🏥 HIPAA — Health Insurance Portability and Accountability Act
HIPAA's Security Rule requires covered entities to implement hardware, software, and procedural mechanisms that record and examine activity in information systems containing PHI. ARPIA's Node Execution Logs directly satisfy this requirement by tracking every access to Knowledge Nodes that may contain PHI, including the user, source, duration, and any errors encountered.
🧭 NIST AI RMF — AI Risk Management Framework
The NIST AI RMF's MEASURE and MANAGE functions require organizations to monitor AI system performance and detect degradation or anomalous behavior. ARPIA's performance metrics — comparing individual node execution times against WorkArea averages — provide the continuous monitoring capability needed to detect and respond to data pipeline performance issues that could affect AI output quality.
⚡ DORA — Digital Operational Resilience Act
DORA requires financial entities to monitor the performance and availability of ICT systems supporting critical functions, maintain logs of operational incidents, and demonstrate resilience over time. ARPIA's three-tier performance monitoring — Dashboard, Node Performance, and Execution Logs — provides the operational telemetry and historical records required to demonstrate ICT resilience and support DORA's incident reporting obligations.
Updated 26 days ago