
Aerie
Aerie Overview
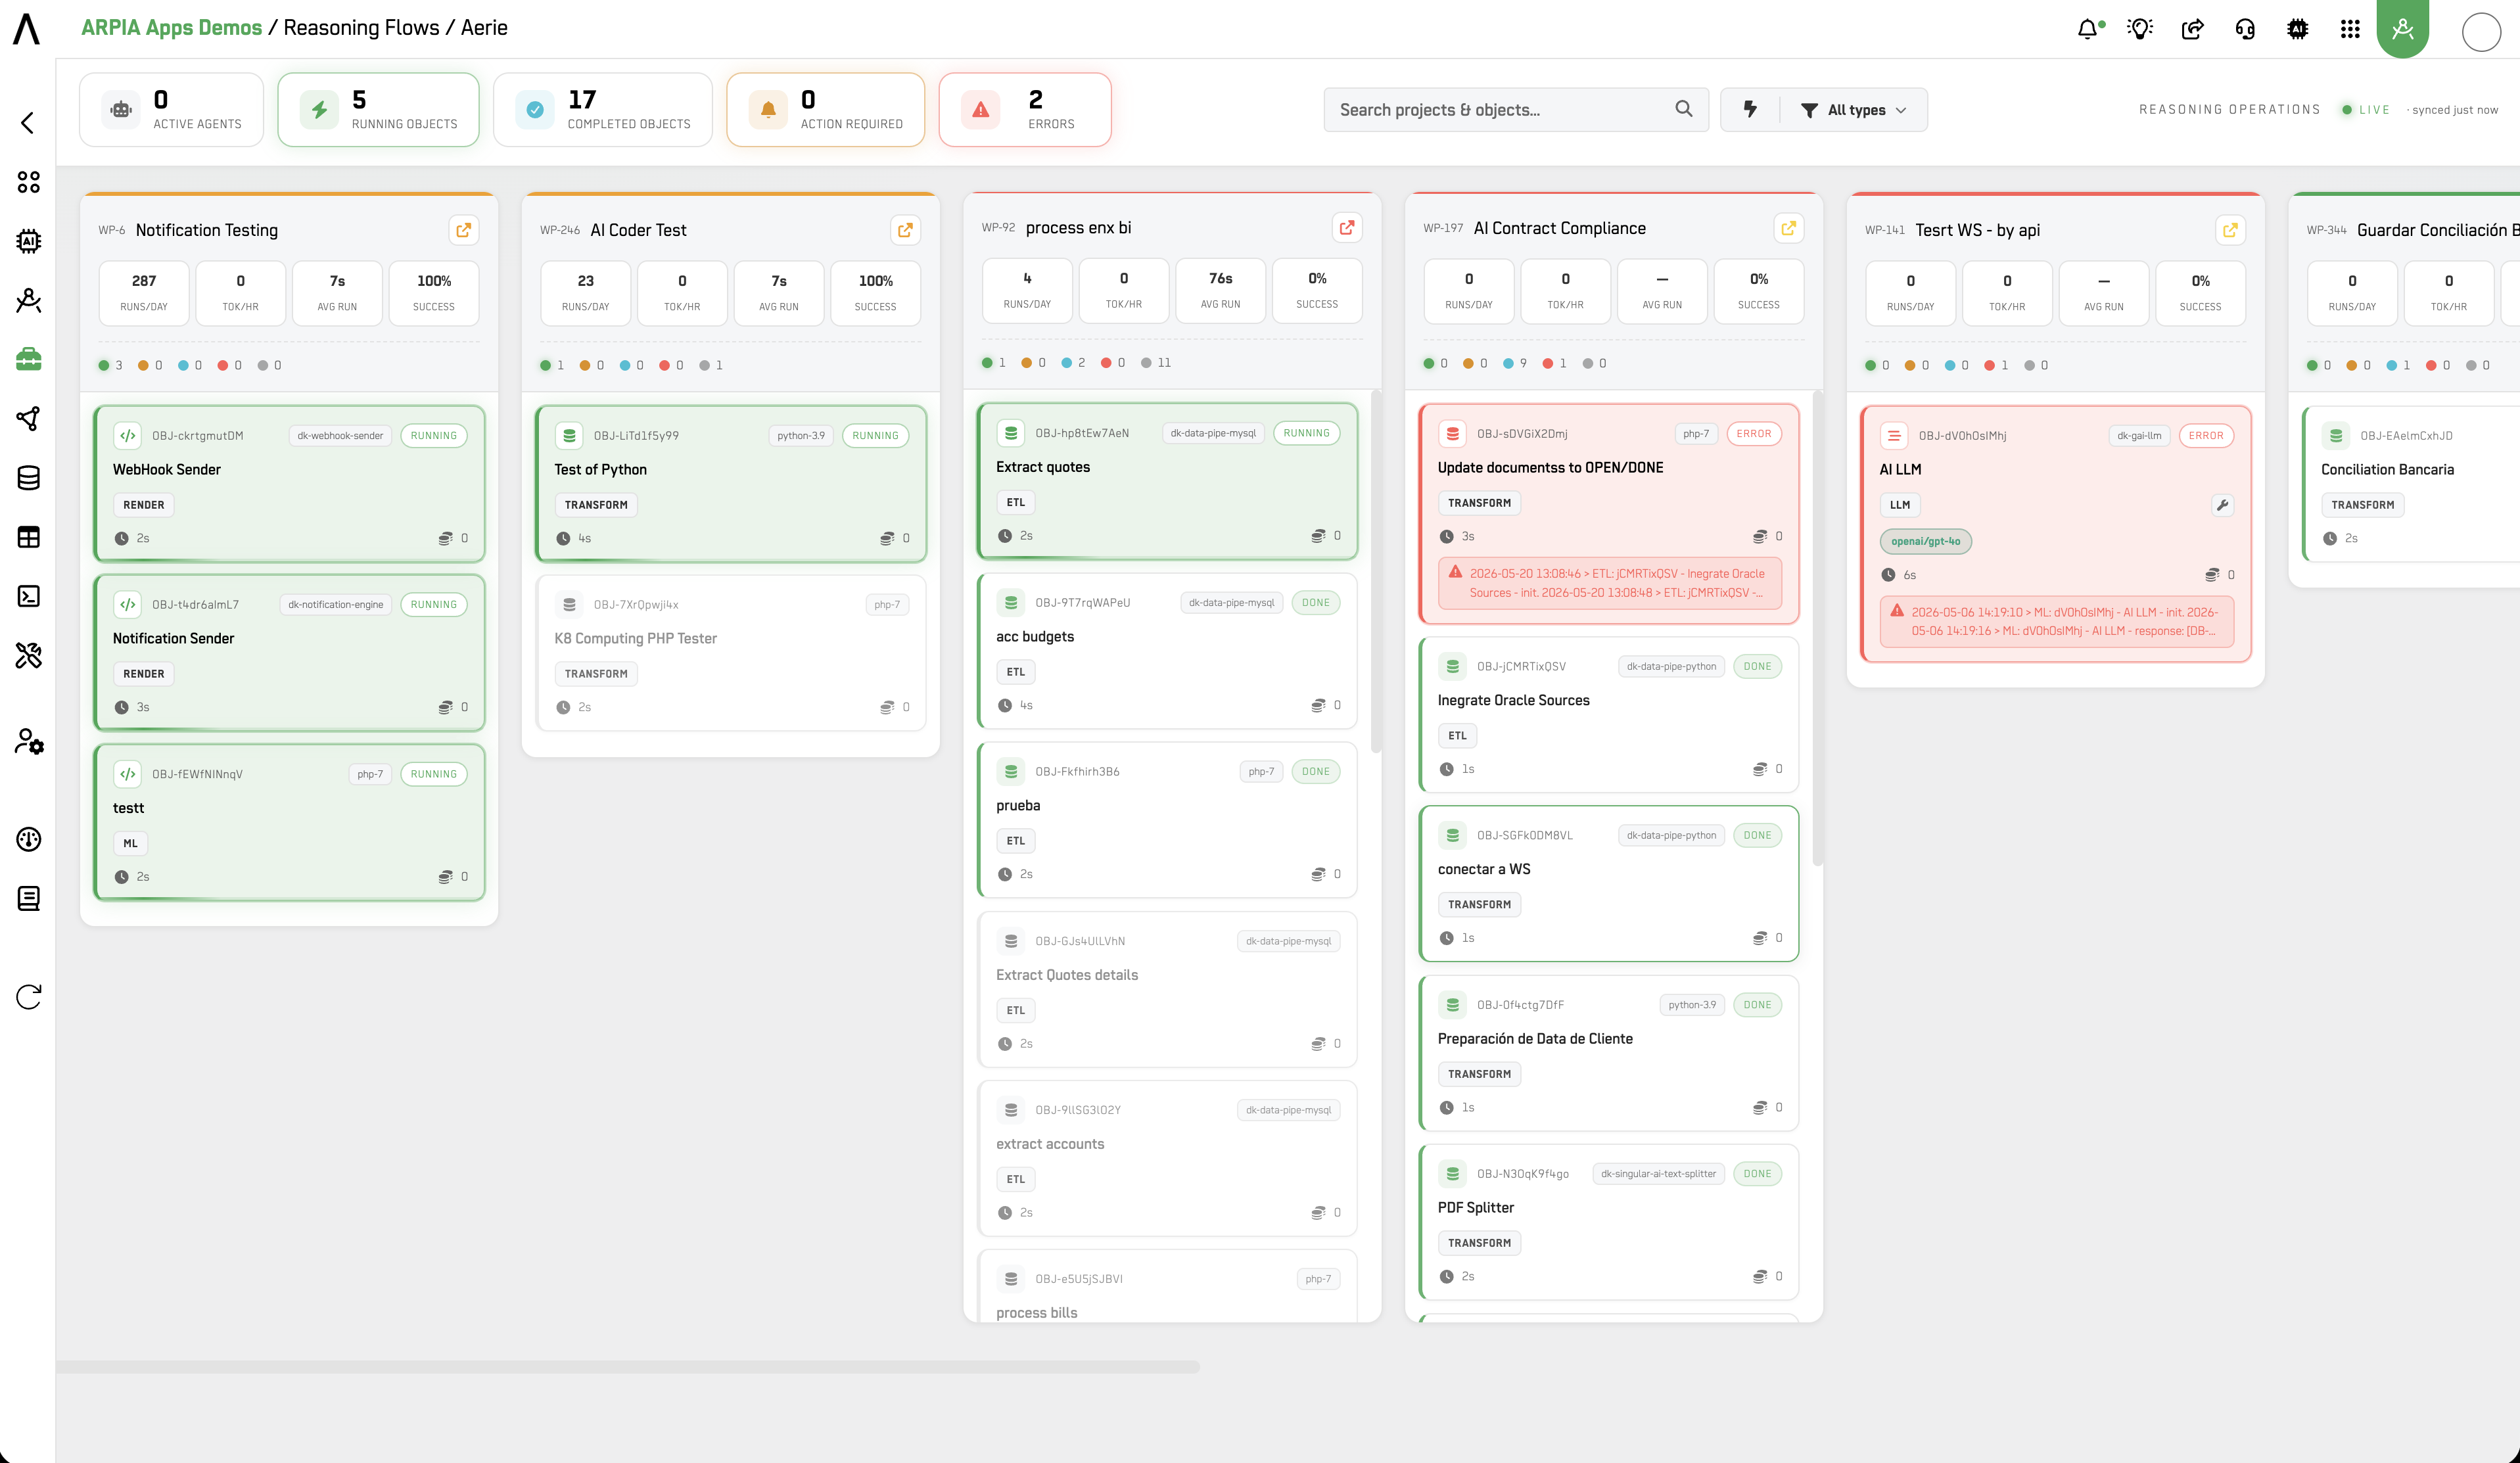
Aerie is the live agent-operations workboard for Reasoning Flows. It gives you a real-time operational view of every project and object in your workarea — so you can watch executions as they happen, spot failures the moment they occur, and act without digging through individual project logs.
Where Reasoning Flows is where you build and Reasoning Atlas is where you understand structure, Aerie is where you operate.
Who Uses Aerie
| Role | How They Use It |
|---|---|
| Platform Administrator | Monitor all active agents and running objects across the workarea. Kill runaway processes before they impact cost or stability. |
| AI / Data Engineer | Track execution status of ETL, ML, and AI Flow objects in real time. Catch failures at the moment they occur without polling individual project logs. |
| CISO / Security Officer | Validate that only expected objects are running. Detect anomalous execution patterns and correlate with AI Governance audit data. |
| CTO / Technical Lead | Review KPIs (runs/day, tok/hr, success rate) across projects to identify underperforming workloads and prioritize optimization. |
| Operations / DevOps | Use Aerie as the first screen for incident triage — see what is running, what failed, and what requires action before escalating. |
Views
Aerie appears in two locations within the platform, each scoped to a different execution layer:
Aerie — Reasoning Operations (accessible from Reasoning Flows)
Covers all objects running within Reasoning Flows — ETL pipelines, ML models, AI Flow objects, and Workshop Nodes. This is the primary operations surface for data and AI workloads.
Aerie — AI Agents (accessible from AI Governance)
Scoped to AI-specific execution: AI Assistants (AI LLM objects), AI Workers, and Arpia Codex jobs. This view surfaces the same object cards and KPIs but filtered to AI execution contexts, making it the natural companion to the AI Governance Overview dashboard.
Global Health Strip
At the top of both views, a global health strip provides a snapshot of your entire workarea at a glance:
| Metric | Description |
|---|---|
| Active Agents | Objects currently executing or polling for work |
| Running Objects | Objects with an active run in progress |
| Completed Objects | Objects that finished successfully in the current window |
| Action Required | Objects that need human intervention to proceed |
| Errors | Objects that failed and have not been resolved |
These counters update in real time. A spike in Errors or Action Required without a corresponding rise in Completed Objects is a reliable early signal of a systemic issue.
Project Columns
Below the health strip, Aerie organizes your workarea into columns — one per active project. Each column displays:
- Project identifier (WP-XX workspace code)
- KPI bar with four metrics:
- Runs/day — execution frequency
- Tok/hr — token consumption rate (AI objects only)
- Avg run — average execution duration
- % Success — success rate over the current KPI window (7 days)
Columns are capped at 12 projects per view. If your workarea exceeds this, use the project filter to scope the view.
Object Cards
Within each project column, individual objects appear as cards. Each card surfaces:
- Object name and type — ETL, Transform, ML, AI LLM, Render, and others
- Object ID — short identifier (e.g.
DBJ-dV0hOsIMh) - Environment badge — runtime environment tag (e.g.
dk-ga-lim,php-7,python-3.9) - Status badge —
RUNNING,DONE,ERROR - Model pills — active AI models bound to the object (e.g.
openai/gpt-4o) - Execution timer — elapsed time for the current or last run
- Token counter — cumulative token usage
- Log preview — last log entry displayed inline on the card for immediate triage
Clicking a card opens the detailed execution log for that object.
Controls
Kill a Running Process
Any object with an active run can be terminated directly from its card. Use this when a runaway process is consuming excessive tokens or blocking downstream dependencies.
Type Filters
Filter the board by object type to focus on specific workload categories: ETL, Transform, ML, AI Flow, and others.
Execution Mode Filters
Filter by execution mode: Batch, Interact, API, MCP, WARP.
Relationship to AI Governance
Aerie and the AI Governance Overview are complementary surfaces. Aerie shows you what is running right now — the operational layer. AI Governance Overview shows you aggregate performance over time — the analytical layer.
For incident response, the recommended flow is: detect in Aerie → correlate in AI Governance Overview (provider health, success rate, token anomalies) → escalate with full context.
Related
- Reasoning Flows Overview — where objects are built and configured
- Reasoning Atlas — structural map of object relationships
- AI Governance Overview — aggregate metrics and provider health
Updated about 1 month ago