
ARPIA Data Layer Framework
Standard definitions, color coding, and governance rules for Raw, Clean, Gold, and Optimized data layers in Arpia.
Purpose
This framework establishes a common language and clear structure for classifying, governing, and consuming data in ARPIA. This terminology is used across the organization for both technical documentation and business communication, ensuring consistency and shared understanding among teams.
Data Layers Overview
ARPIA uses a four-layer data architecture to organize data by quality, transformation state, and consumption readiness. Each layer has a defined purpose, color code, and governance rules.
| Layer | Tag | Color | Purpose |
|---|---|---|---|
| Raw | RAW | Grey ⚪ | Source data as-is, no transformation |
| Clean | CLEAN | Blue 🔵 | Validated and standardized data |
| Gold | GOLD | Gold 🟡 | Business-ready, single source of truth |
| Optimized | OPTIMIZED | Green 🟢 | Tailored for specific use cases |
Layer Definitions
1. Raw
Definition: Data as it arrives from sources (ERP, POS, IoT, external integrations, files, APIs).
Characteristics:
- No transformation or cleaning applied.
- May contain duplicates, nulls, or format errors.
- Represents the exact "snapshot" of the source.
Examples:
ventas_raw— sales data with dates as strings and inconsistent fields.maestro_sociedades_raw— master data exported directly from SAP.
Color/Tag: Grey ⚪ with tag RAW
2. Clean
Definition: Data processed by transformation objects (such as AP Prepared Table or AP SQL Code Execution), validated and standardized.
Note: This layer is equivalent to "Silver" in medallion architecture terminology. You may encounter
_silversuffixes in legacy tables — these follow the same standards as_cleantables.
Characteristics:
- Correct data type casting applied.
- Null values handled, duplicates removed.
- Includes clean master data and normalized tables.
- May or may not be included in the Knowledge Grid, but must always be tagged and color-coded.
Examples:
ventas_clean— sales data with typed dates and normalized costs.dim_articulo_clean— article dimension with unified hierarchies.
Color/Tag: Blue 🔵 with tag CLEAN
3. Gold
Definition: Data ready for business consumption and inclusion in the Knowledge Grid.
Characteristics:
- Aggregated or transformed into KPIs and business metrics.
- Ambiguity-free: defines the "single source of truth" for sales, budgets, margins, etc.
- Serves as the foundation for both traditional dashboards and AI assistants.
Examples:
agg_ventas_mes_tienda_gold— monthly sales by store with Net Sales, Budget, Compliance, and Profitability.agg_ventas_dia_regional_gold— daily regional sales for operational analysis.
Color/Tag: Gold 🟡 with tag GOLD
4. Optimized
Definition: Subset of Clean or Gold data, tailored and optimized for a specific process, application, or consumption pattern.
Characteristics:
- Always documented with its associated Knowledge Node.
- May include indexes, special partitions, or wide structures to accelerate a use case.
- Maintains traceability back to its Clean or Gold origin.
Examples:
agg_forecast_ventas_optimized— optimized for AI predictive models.agg_tienda_dia_dashboard_optimized— optimized for fast executive dashboards.
Color/Tag: Emerald Green 🟢 with tag OPTIMIZED
Table Naming Conventions
To ensure tables are easily identifiable by layer, follow these naming patterns:
| Layer | Suffix | Prefix Pattern | Example |
|---|---|---|---|
| Raw | _raw | Source name | ventas_raw, clientes_raw |
| Clean | _clean | dim_ for dimensions, source name for facts | dim_articulo_clean, ventas_clean |
| Gold | _gold | agg_ for aggregates, fact_ for facts | agg_ventas_mes_gold, fact_orders_gold |
| Optimized | _optimized | Based on use case | agg_forecast_ventas_optimized |
Prefix Definitions:
dim_— Dimension tables (master data, reference data)fact_— Fact tables (transactional data)agg_— Aggregated tables (pre-calculated summaries)
How Layers Connect

| Transition | Responsible Team | ARPIA Objects Used |
|---|---|---|
| Source → Raw | Data Engineering | AP DataPipe Engine, Python 3.12 DataPipe |
| Raw → Clean | Data Engineering | AP Prepared Table, AP SQL Code Execution, AP Transform objects |
| Clean → Gold | Data Engineering + Data Analysts | AP SQL Code Execution, AP Prepared Table |
| Gold → Optimized | Process/Application Owner | Custom objects based on use case |
Applying Tags and Colors
Tags
Tags are applied as metadata in the Repository Table settings:
- Open the table in Repository Tables.
- Navigate to Settings or Properties.
- In the Layer Tag field, select the appropriate value:
RAW,CLEAN,GOLD, orOPTIMIZED.
Colors
Colors are applied automatically based on the layer tag in:
- Repository table listings
- Data lineage diagrams
- Knowledge Grid visualizations
- Documentation exports
When creating diagrams or documentation manually, use these color codes:
| Layer | Hex Code | RGB |
|---|---|---|
| Raw (Grey) | #9E9E9E | 158, 158, 158 |
| Clean (Blue) | #2196F3 | 33, 150, 243 |
| Gold (Gold) | #FFC107 | 255, 193, 7 |
| Optimized (Green) | #4CAF50 | 76, 175, 80 |
Knowledge Grid Integration
The Knowledge Grid is ARPIA's semantic layer that defines how data is exposed to dashboards, reports, and AI assistants. It contains metadata about metrics, hierarchies, joins, and usage policies.
Layer Eligibility:
| Layer | Knowledge Grid Eligible | Notes |
|---|---|---|
| Raw | ❌ No | Never exposed to end users |
| Clean | ⚠️ Limited | For exploratory analysis and validation only |
| Gold | ✅ Yes | Primary source for business consumption |
| Optimized | ✅ Yes | Must have associated Knowledge Node documentation |
Knowledge Node: A Knowledge Node is the documentation record for a dataset in the Knowledge Grid. It defines the table's metrics, dimensions, relationships, refresh schedule, and usage policies.
Governance Rules
Tagging Requirements
- All datasets must be tagged with their layer (
RAW,CLEAN,GOLD,OPTIMIZED). - Official colors must be used in documentation, diagrams, and dashboards to visually reinforce the layer.
- Table names must include the appropriate suffix (
_raw,_clean,_gold,_optimized).
Consumption Rules
| Layer | Allowed Consumers |
|---|---|
| Raw | Data Engineering pipelines only |
| Clean | Data teams for exploration and validation |
| Gold | Dashboards, reports, AI assistants, business users |
| Optimized | Specific application or process as documented |
Prohibited:
- No dashboard or AI assistant may consume Raw data directly.
- No production reports may reference Clean data without explicit approval.
Responsibilities
| Transition | Owner |
|---|---|
| Raw → Clean | Data Engineering |
| Clean → Gold | Shared — Data Engineering (technical) + Data Analysts (business rules) |
| Gold → Optimized | Process or application owner; must document in Knowledge Grid |
Visual Flow
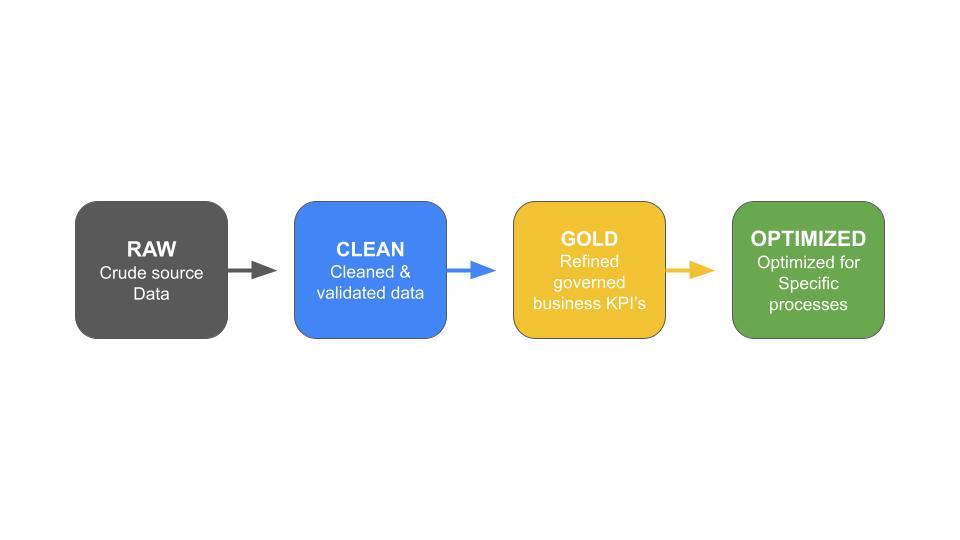
Note: Verify this image displays the correct data layer flow diagram.
Related Documentation
-
Extract & Load
Learn how data is ingested from sources into the ARPIA platform (Source → Raw). -
Repository Tables
Explore how loaded data is organized and managed within internal repositories. -
Transform & Prepare
Continue to the next stage of the ETL lifecycle — cleaning, enriching, and structuring data (Raw → Clean → Gold). -
Knowledge Grid
Understand how Gold and Optimized data is exposed to dashboards and AI assistants.
Updated 7 months ago